
Biotechnological
Communication
Biosci. Biotech. Res. Comm. 10(1): 63-71 (2017)
Development of 3D QSAR based pharmacophore model
for neuraminidase in In uenza A Virus
Sudha Singh, Anvita Gupta Malhotra, Mohit Jha and Khushhali M. Pandey*
Department of Biological Science and Engineering Maulana Azad National Institute of Technology, Bhopal
(India)
ABSTRACT
A number of new advances in computer - aided drug designing have reduced the effective cost and time involved
in drug discovery. However, the quest for more effective compounds often faces stiff challenge due to increased
drug resistance. Pharmacophore modeling has emerged as a method with a lot of potential and is increasingly used
for designing new molecules by using available knowledge of activity of compounds. 3D Quantitative Structure -
Activity Relationship (QSAR) based pharmacophore modeling is a reliable method for developing new chemical
moieties. In uenza A virus results in acute respiratory infection with serious consequences for the elderly and high
– risk patients. Neuraminidase inhibitors are the well - known drugs that are frequently used against in uenza virus.
The current work has focused on developing a 3D QSAR based pharmacophore model for neuraminidase enzyme by
using a dataset of known inhibitors. The best quantitative pharmacophore model selected was made of one hydrogen
bond acceptor, one hydrogen bond donor and hydrophobic aliphatic features with high correlation value of 0. 917.
Pharmacophore model was cross - validated by Fischer randomization and leave - one - out method to check the reli-
ability of model. The ndings can prove out to be quite helpful in screening new molecules against neuraminidase.
KEY WORDS: NEURAMINIDASE, DISCOVERY STUDIO, 3D - QSAR, PHARMACOPHORE, COMPUTER – AIDED DRUG DESIGN
63
ARTICLE INFORMATION:
*Corresponding Author: menaria.khushhali@gmail.com
Received 27
th
Nov, 2016
Accepted after revision 21
st
Feb, 2017
BBRC Print ISSN: 0974-6455
Online ISSN: 2321-4007 CODEN: USA BBRCBA
Thomson Reuters ISI ESC and Crossref Indexed Journal
NAAS Journal Score 2017: 4.31 Cosmos IF : 4.006
© A Society of Science and Nature Publication, 2017. All rights
reserved.
Online Contents Available at: http//www.bbrc.in/
INTRODUCTION
In uenza virus is a member of Orthomyxoviridae fam-
ily of viruses. Based on differences in the nucleoprotein
(NP) and matrix (M1) protein, this virus is classi ed into
three major categories - A, B and C. In uenza A, known
for the infection of mammalian species, is divided into
18 HA subtypes (H1 - H17) and 11 NA (N1 - N9). This
division is based on serological reactivates of surface
proteins, hemagglutinin (HA) and neuraminidase (NA)
(Ferguson et al., 2015, Ducatez et al., 2015). Various
types of in uenza viruses have signi cant difference in
64 DEVELOPMENT OF 3D QSAR BASED PHARMACOPHORE MODEL FOR NEURAMINIDASE IN INFLUENZA A VIRUS BIOSCIENCE BIOTECHNOLOGY RESEARCH COMMUNICATIONS
Sudha Singh et al.
their host range and pathogenicity. They infect a variety
of animals including pigs, horses, whales, dogs, bats and
birds (Nayak et al., 2010, Rajao and Vincent, 2015).
Infection caused by In uenza virus, commonly
known as u, is responsible for acute respiratory infec-
tion, with signi cant morbidity in the population and
mortality in the elderly and high–risk patients. It is
also a prominent cause of disability and death and is
therefore a serious public health issue (Kobasa et al.,
2004). One of the main limitations in new drug dis-
covery is drug resistance in mutant strains (Renzette et
al., 2014). M2 protein and Neuraminidase (NA) are the
two main drug targets for commonly available drugs.
M2 protein inhibitors like amantadine and rimantadine
have narrow spectrum of activity, hence provide lim-
ited protection(Hay et al., 1985, Hastings et al., 1996,
Mammen et al., 1995, Colman, 1989, De Clercq, 2001).
Another target Neuraminidase (NA) is a glycoprotein. It
acts as an enzyme and participates in the release of the
progeny virus from infected cells(Gong et al., 2007, Var-
ghese and Colman, 1991). Two well - known Neurami-
nidase inhibitors are Zanamivir and Oseltamivir. Zan-
amivir is known for excellent anti-viral activity during
intranasal administration but is not too effective when
delivered systemically. Oral bioavailability of Zanamivir
is low and easily eliminated by renal excretion(Ryan et
al., 1995). Oseltamivir is orally active but the associated
side effects like vomiting, nausea and several allergic
reactions do not augur well for a promising drug(Burch
et al., 2009). Few other Neuraminidase inhibitors such
as Peramivir, Laninamivir are in phase III clinical trials
(Hata et al., 2014). Peramivir shows less oral bioavail-
ability as compared to Oseltamivir(de Jong et al., 2014).
So the situation is worrying and there is a need to design
and identify new effective compounds for chemotherapy
of in uenza virus infection.
Pharmacophore modeling is one of the most impor-
tant and extensively used method in ligand - based drug
design. There are various studies in literature where
pharmacophore modeling was used as an effective tool
to understand the important features for well - known
target inhibitors. The pharmacophore model is widely
acknowledged as a balanced quantitative model that
can be used to explore common chemical characteristics
among a considerable number of structures with great
diversity. Quali ed pharmacophore model could also be
used as a query for searching chemical databases to nd
new chemical entities. Quantitative Structure-Activity
Relationship (QSAR) is an effective statistical method
used to design new chemical moieties from the previ-
ous knowledge of activity of known compounds(John et
al., 2010, Li et al., 2015). Different classes of inhibitors
could be useful in digging out valuable information for
developing new potent NA inhibitors.
This study aims to construct the chemical features
based on pharmacophore models for neuraminidase. A
high correlation quantitative pharmacophore model was
generated, using observed structure-activity relationship
of known neuraminidase inhibitors. The pharmacophore
modeling was successfully applied for the development
of new model and validated with available methods.
This work is signi cant in connection with discovery of
new molecules and may contribute to the development
of more effective chemical moieties.
MATERIALS AND METHODS
(1) Selection of Data Set Compounds
3D QSAR method is one of the ligand – based phar-
macophore modeling strategies used for the discovery
of new effective compounds [12]. This strategy diverges
from the usual pharmacophore approach in the num-
ber of training set compounds’ requirement and need of
experimental activity values predicted through similar
bioassay conditions, etc. A data set of 46 compounds
was retrieved from BRENDA database and literature
and the redundancy was removed (Schomburg et al.,
2004). Out of 46 compounds, 18 diverse compounds
were selected for training data set with the experimental
activity values (IC
50
) ranging from 0.0032 nM to 8640
nM and structural diversity. These compounds were also
utilized in pharmacophore cross - validation.
(2) Compound Preparation and Conformation Generation
The ChemSketch Version 12 was used to design the
2D structures of compounds and conversion of these
compounds to 3D structures was done with the help of
Accelrys Discovery Studio 3.1. Hydrogen atoms were
then added to these prepared compounds and veri ed
later. This was followed by energy minimization pro-
cess using Smart Minimizer that carries out 1000 steps
of steepest descent. This is then followed by applica-
tion of conjugate gradient algorithms with convergence
gradient of 0.001 kcal/mol. After completion of energy
minimization, a number of acceptable conformers were
generated for every training set compound within DS
Diverse conformation generation module employing the
poling algorithm for conformational analysis. The pol-
ing algorithm eliminates the chances of redundancy in
conformation generation and this, in turn, improves the
coverage of the conformational space. Within an energy
range of 20kcal/mol above the global energy minimum,
maximum number of conformers generated for each
compound was limited to 255 (Schuster et al., 2006,
Bharatham et al., 2007, Neves et al., 2009). This practi-
cally means that the difference in energy values among

BIOSCIENCE BIOTECHNOLOGY RESEARCH COMMUNICATIONS DEVELOPMENT OF 3D QSAR BASED PHARMACOPHORE MODEL FOR NEURAMINIDASE IN INFLUENZA A VIRUS 65
Sudha Singh et al.
different conformers of a particular compound was <
20kcal/mol.
(3) Generation of Pharmacophore Models
Ligand – based pharmacophore modeling is divided into
two types methodologies one is common feature phar-
macophore modeling utilized the common features pre-
sent only in the most active compounds and another
one based on 3D QSAR pharmacophore–the new design
compounds activity estimated by using pharmacophore
models, generation of this model by used the most active
and inactive compounds’ chemical features with phar-
macological activity. The training set compounds fea-
tures identify by feature mapping protocol available in
DS. The values of Uncertainty and the minimum inter
– feature distances were set respectively to 2 and 2Å. In
DS -3D QSAR pharmacophore generation used the Fea-
ture mapping protocol identi ed hydrogen bond accep-
tor (HBA), hydrogen bond donor (HBD), hydrophobic
aliphatic (HY-AL), hydrophobic aromatic (HY-AR) and
ring aromatic (RA) features with other default values to
generate ten pharmacophore models.
Biological activity of compounds that is directly rel-
atively contributed to each feature of the model has a
certain weight. The process of HypoGen pharmacophore
model generation divided into three major steps - the con-
structive phase, the subtractive phase and the optimiza-
tion phase(Kurogi and Guner, 2001, Kansal et al., 2010). In
constructive phase of Hypotheses identi ed the common
maximum number of active set compounds. HypoGen all
combinations of pharmacophore features using for deter-
mines all possible pharmacophore con gurations Apart
from this, the hypotheses must t a minimum subset of
features of the remaining most active compounds. The
end of the constructive phase coincides with generation
of a large database of pharmacophore con gurations.
The subtractive phase, on the other hand, goes through
elimination of all phramacophore con gurations that also
exist in the least active set of molecules. The least active
molecules here are considered to be those compounds
whose activity levels are less by 3.5 orders of magnitude
than that of the most active compound, though this order
is not xed and can be modi ed in accordance with the
activity of the training set.
The errors in activity estimates obtained through
regression and complexity serve as adequate basis for
scoring the hypotheses. The hypotheses scores get further
improved in the optimization phase. This phase employs
a simulated annealing approach. The activity prediction
is optimized by considering variation of features and/
or locations. HypoGen stops after reaching the point
beyond which no further score improvement is possible.
It then provides top scoring 10 unique pharmacophore
models. The reliability of these models is assesses on the
basis of different cost parameters. The overall cost of a
model consists of the weight cost, the error cost, and the
con guration cost. The weight cost shows a Gaussian
increase pattern, the error cost is an indication of the
difference between estimated and measured activities of
the training set and the con guration cost is a quantita-
tive measure of the hypothesis space entropy.
The generation of pharmacophore models also
involves calculation of three additional cost values – the
xed cost, the total cost, and the null cost. The xed
cost is the least possible cost that represents the simplest
hypothetical model that provides a perfect t for the
data. Fixed costs consist of minimum achievable error,
weight cost and the constant con guration cost. The
null cost, on the other hand, is the maximum cost of a
pharmacophore and calculates the average of activity
data of training set molecules. It matches with the maxi-
mum error cost. To generate a pharmacophore model, a
total of ten cost values along with their xed and null
cost were estimated. Ideally, the model should have a
low xed cost and high null cost values. Alongside, the
difference between the total and xed values should
be minimum whereas the difference between total and
null values should be maximum (Sundarapandian et al.,
2010, Sanam et al., 2009). Further, regression analysis
was performed employing HypoGen for predicting activ-
ity of the training set compounds. This study was done
using the relationship of geometric t value V/s the
negative logarithm of activity. The activity prediction is
directly proportional to the geometric tness. Other sta-
tistical parameters, namely - correlation coef cient and
root mean square deviation (RMSD) were also computed.
Finally, the model with high cost difference and correla-
tion coef cient with low RMSD was selected.
(4) Pharmacophore Cross Validation
The models were cross validated to assess their ability to
predict the activity of any new compound. The identi ed
best model was validated via two approaches based on
derived cost modules - the Fischer randomization test and
leave – one - out method. All the cost values are stated
in bits and 75 - 90% correlation is proposed by a differ-
ence of 40 - 60 bits. The Fischer randomization approach
for validation of the pharmacophore model involved
construction of 19 random spread sheets with 95% con-
dence level (Sarma et al., 2008, Thangapandian et al.,
2011a). In this study the correlation between the biologi-
cal activity and the chemical structures is tested by rand-
omizing the activity data of training set compounds. The
models were generated using the same parameters which
were used to build the original model but the activity val-
ues were randomized. The second is the leave – one - out
method, where 18 pharmacophore models were generated
with the same parameters used for generating original
Sudha Singh et al.
66 DEVELOPMENT OF 3D QSAR BASED PHARMACOPHORE MODEL FOR NEURAMINIDASE IN INFLUENZA A VIRUS BIOSCIENCE BIOTECHNOLOGY RESEARCH COMMUNICATIONS
pharmacophore model but leaving one compound at a
time from the training set compounds. This is done to
state the effect of every single training set compound in
the generation of selected pharmacophore model (Stoll
et al., 2002, Zampieri et al., 2009).
RESULT AND DISCUSSION
PHARMACOPHORE GENERATION
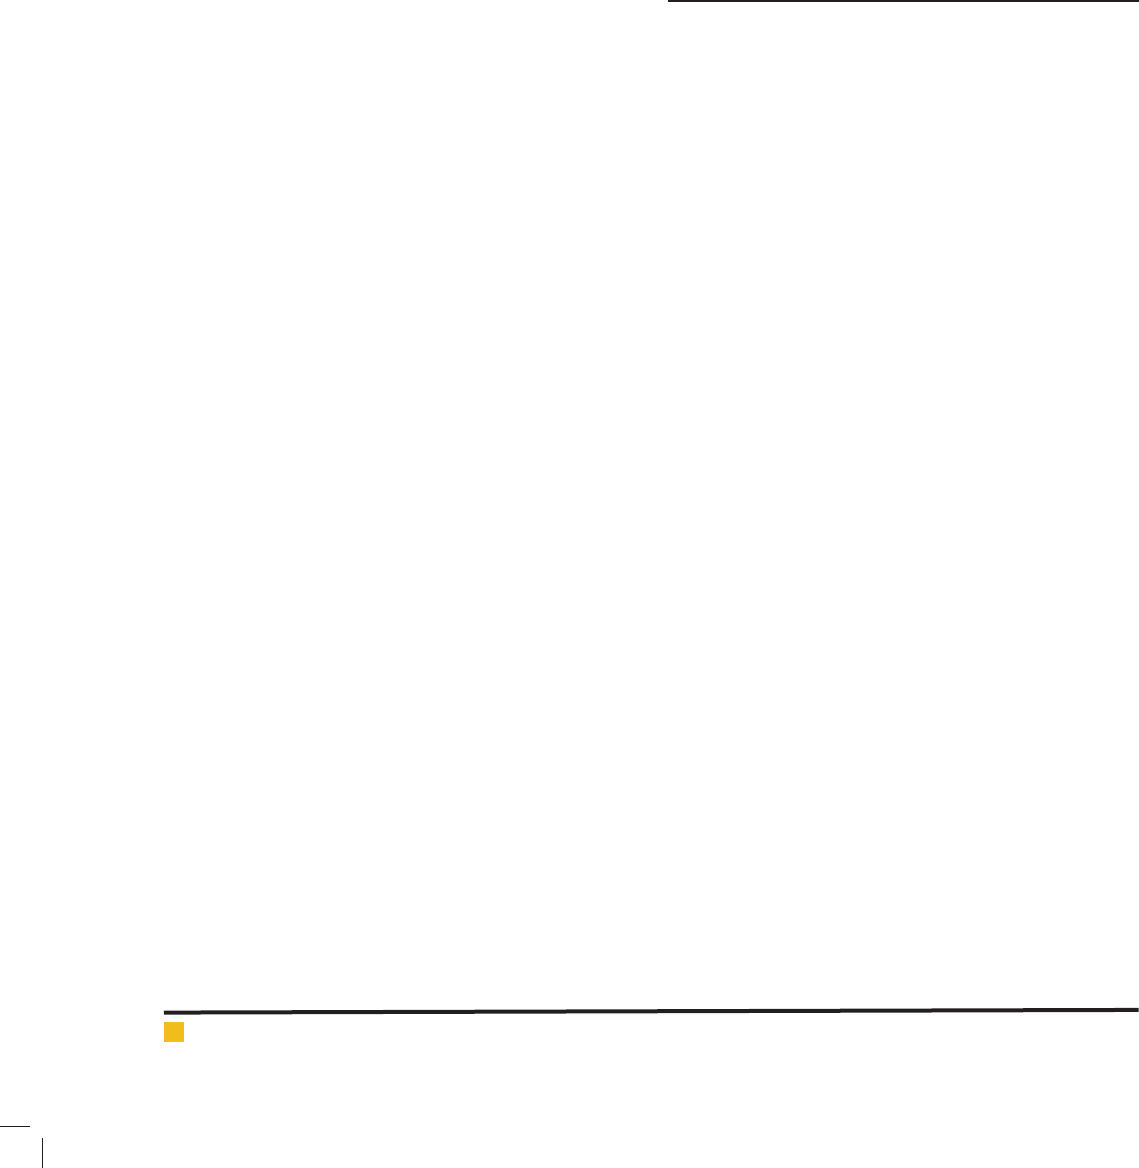
A training set with 18 compounds is used for the gener-
ation of ten pharmacophore models. Structures of these
training set compounds are shown in (Figure 1). These
models were generated by using HBA, HBD, HY-AL,
HY-AR and RA features from the Feature Mapping
Protocol(Arooj et al., 2013). All the selected pharmaco-
phore models consisted of either HBA or HBD or both,
with HY-AL or HY-AR. Total cost values ranged from
94.22 to 98.28.
The pharmacophore generation run in this study
revealed xed cost value and null cost value as 77.44
and 157.052 respectively. The analysis of ten generated
pharmacophores models indicates that the total cost
value for the rst model (Hypo 1) is the closest to the
xed cost value vis – à - vis other models. The cost dif-
ference between the null cost and total cost value of the
rst pharmacophore model is 62.83 (Table 1). A cost dif-
ference value between 40 and 60 signi es that the phar-
macophore model correlates the experimental and pre-
dicted activity. Herein, the cost difference value of Hypo
1 signi es the correlation between the experimental and
predicted activity values of more than 90% of the train-
ing set compounds(Vuorinen et al., 2014, Kandakatla
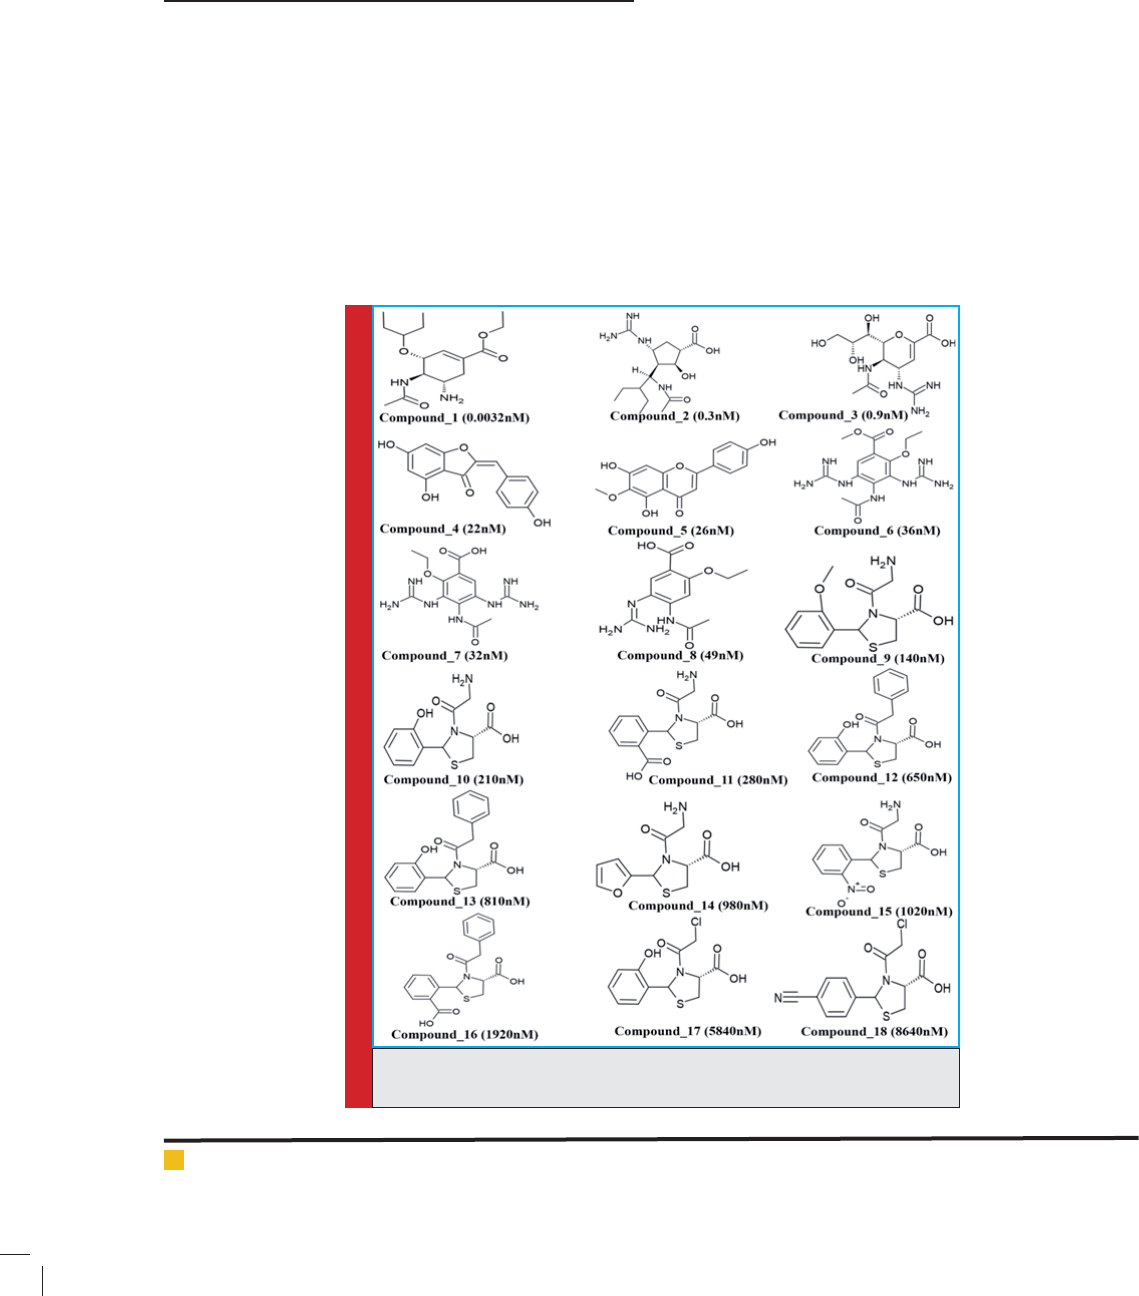
and Ramakrishnan, 2014). The Hypo 1 pharmacophore
model, being the best, was selected and consisted of two
HBA, one HBD and one HY-AL features (Figure 2).
Further investigation of the generated pharmacoph-
ore models was based on the selected ten pharmacoph-
FIGURE 1. 2D Structure of the training set compounds. 2D Chemical struc-
tures of the 18 training set with their experimental IC50 values

Sudha Singh et al.
BIOSCIENCE BIOTECHNOLOGY RESEARCH COMMUNICATIONS DEVELOPMENT OF 3D QSAR BASED PHARMACOPHORE MODEL FOR NEURAMINIDASE IN INFLUENZA A VIRUS 67
Table 1. Statistical Results of the 10 Pharmacophore Hypothesis generated by Hypo Gen
Algorithm
Hypothesis Total cost Cost difference RMSD Correlation Features
Hypo 1 94.2211 62.8309 1.30795 0.917666 HBA HBD HBD HY-AL
Hypo 2 95.2269 61.8251 1.36582 0.909478 HBA HBD HBD HY-AL
Hypo 3 96.7312 60.3208 1.40736 0.903947 HBA HBD HBD HY-AL
Hypo 4 97.0164 60.0356 1.41827 0.902366 HBA HBD HBD HY-AL
Hypo 5 97.34 59.712 1.44001 0.898952 HBA HBD HBD HY-AL
Hypo 6 97.9418 59.1102 1.50229 0.888384 HBA HBD HBD HY-AL
Hypo 7 98.251 58.801 1.50229 0.888384 HBA HBD HBD HY-AL
Hypo 8 98.2555 58.7965 1.50857 0.887742 HBA HBD HBD HY-AL
Hypo 9 98.2683 58.7837 1.5014 0.889011 HBA HBD HBD HY-AL
Hypo 10 98.2848 58.7672 1.49708 0.889783 HBA HBD HBD HY-AL
Null cost = 157.052; xed cost = 77.44; con guration cost = 15.77
Cost difference = null cost – total cost.
HBA, hydrogen bond acceptor; HBD, hydrogen bond donor; hydrophobic aliphatic
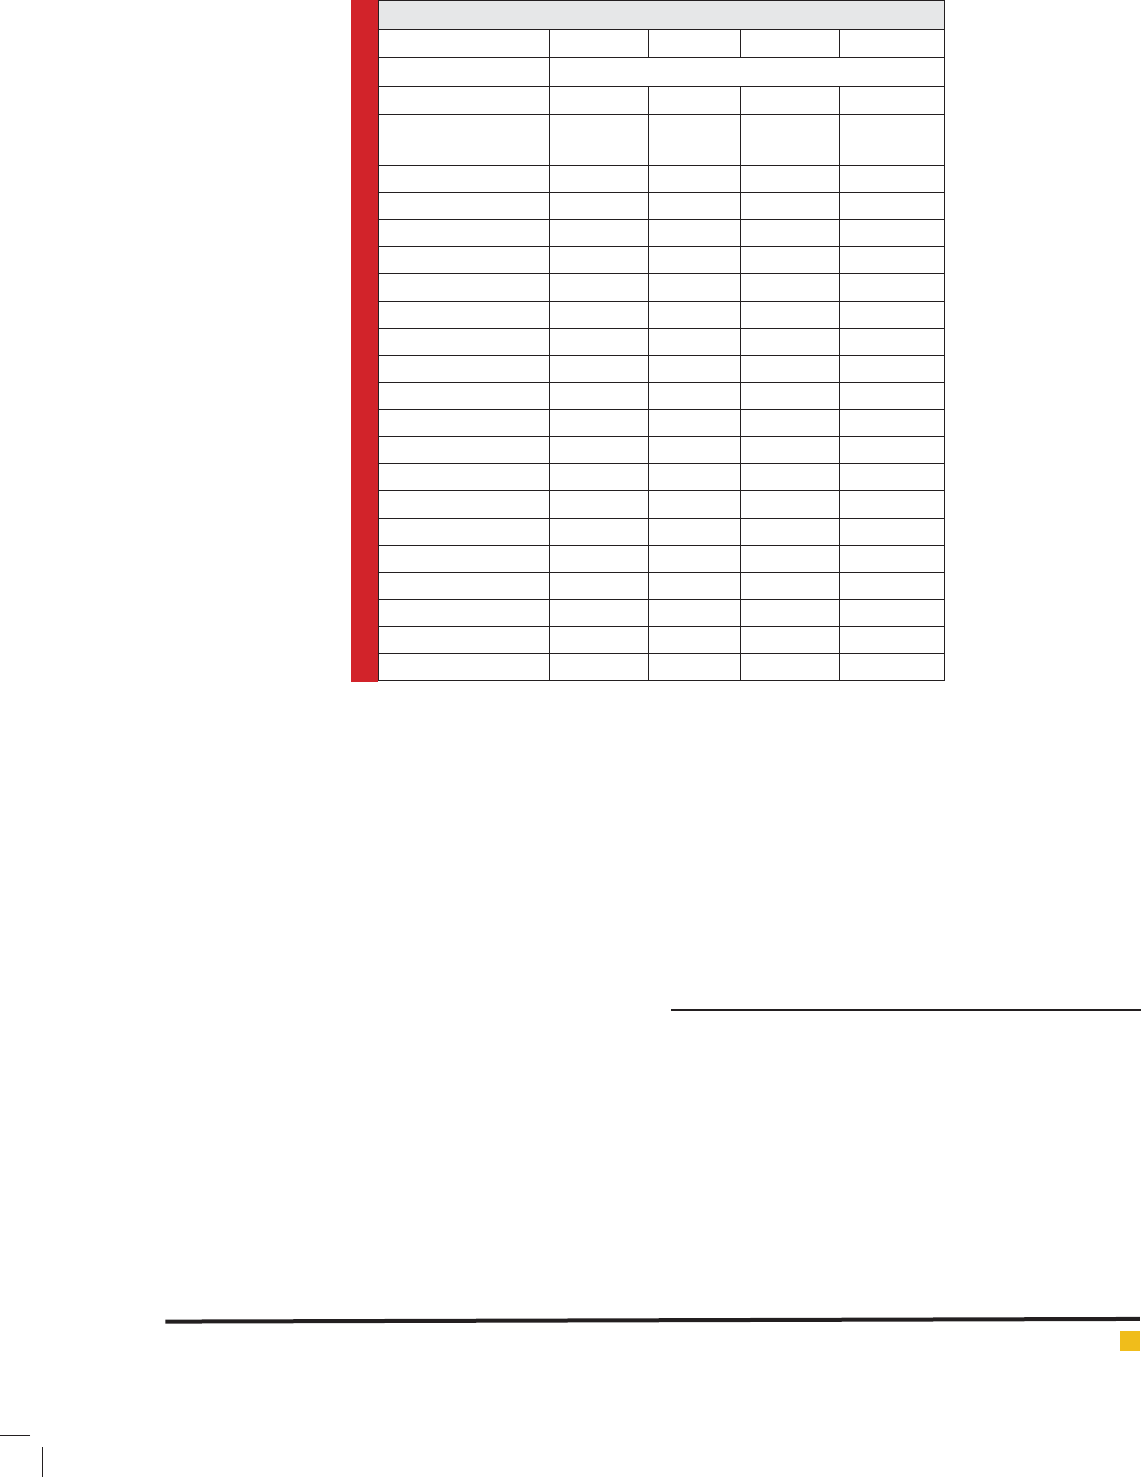
Table 2. Experimental and Estimated IC
50
Values of the Training Set Compounds based on Best
Pharmacophore.
Name IC
50
nM Error Fit value Activity scale
Experimental Estimated Experimental Estimated
Compound 1 0.0032 0.012 2.6 9.65 ++++ ++++
Compound 2 0.3 0.34 3.9 8.21 ++++ ++++
Compound 3 0.9 3.7 2.8 7.17 ++++ ++++
Compound 4 22 850 21 4.81 +++ ++
Compound 5 26 170 13 5.52 +++ +++
Compound 6 36 12 -4.1 6.68 +++ +++
Compound 7 32 56 -1.3 5.99 +++ +++
Compound 8 49 66 -1.3 5.92 +++ +++
Compound 9 140 19 -7.6 6.45 +++ +++
Compound 10 210 38 6.16 1.1 ++ +++
Compound 11 280 240 1.1 5.36 ++ ++
Compound 12 650 750 -1.6 4.86 ++ ++
Compound 13 810 550 -1.8 5 ++ ++
Compound 14 980 620 -2.2 4.95 ++ ++
Compound 15 1020 560 -2.8 4.99 + ++
Compound 16 1920 5300 5.9 4.01 + +
Compound 17 5840 730 -15 4.87 + ++
Compound 18 8640 1800 -3.9 4.48 + +
a
Positive value indicates that the estimate IC
50
is higher than the experimental IC
50
; negative value indicates that the
estimate IC
50
is lower than the experimental IC
50
.
b
Fit value indicates how well the features in the pharmacophore map the chemical features in the compound
Activity scale: IC
50
≤ 10 nM (Most active, ++++); 10< IC
50
≤ 200 nM (Active, +++); 200< IC
50
≤ 1000 nM (Moderately
active, ++); > 1000 nM
(inactive, +)
ore models having correlation values greater than 0.889.
Out of them, the top four pharmacophore models corre-
lated the activity data with high correlation values that
were higher than 0.9. These results indicate the capabil-
ity of the pharmacophore model to predict the activity
of the training set compounds. Hypo 1 showed the high-
est correlation coef cient value of 0.9, thus highlighting
its strong predictive ability (Muthusamy et al., 2015).
RMSD values calculated for the top ve pharmacoph-
ore models were less than 1.5 which supports our nd-
Sudha Singh et al.
68 DEVELOPMENT OF 3D QSAR BASED PHARMACOPHORE MODEL FOR NEURAMINIDASE IN INFLUENZA A VIRUS BIOSCIENCE BIOTECHNOLOGY RESEARCH COMMUNICATIONS
FIGURE 2. The Best HypoGen Pharmacophore
Model, Hypo 1. (a) Chemical features present in
Hypo 1 (b) 3D Spatial Arrangement and the Dis-
tance Constraints between the Chemical Features.
Green color represents HBA, magenta color repre-
sents HBD and cyan color represents HY-AL.
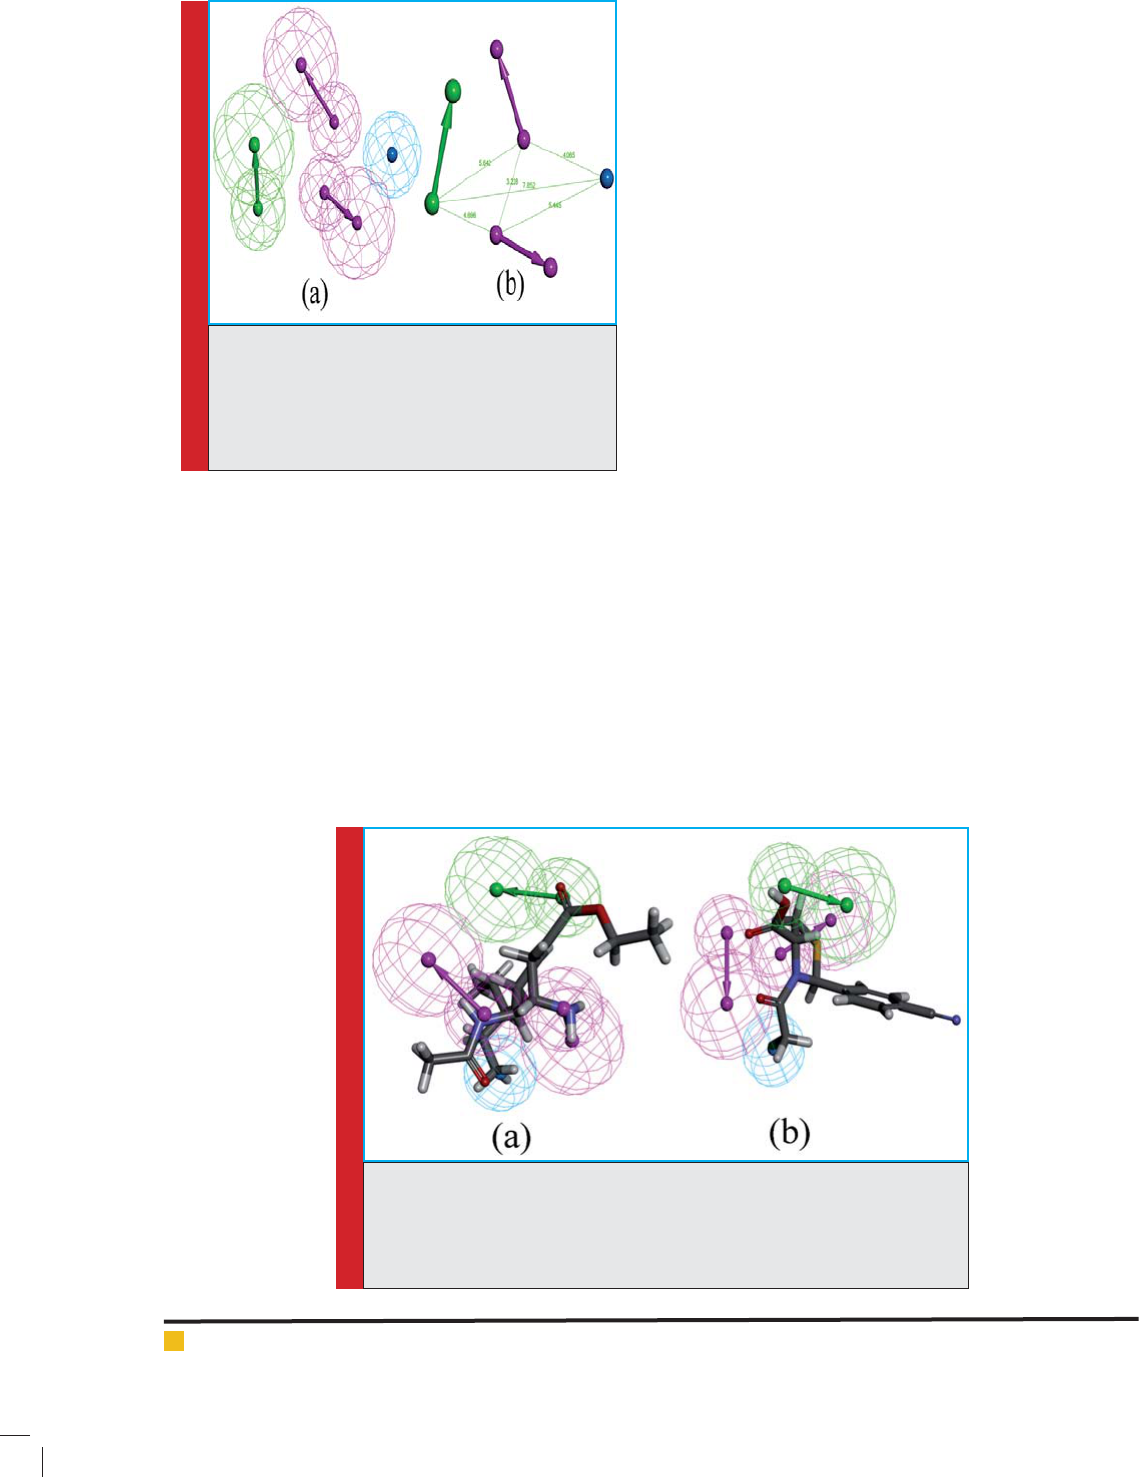
FIGURE 3. Pharmacophore Mapping: Mapping of the most active compounds
1, IC50 = 0.0032 mapped on the best pharmacophore model; (b) the least
active compound (compound 18, IC50 = 8640) mapped on the best pharmaco-
phore model (Hypo 1). In the pharmacophore model - green represents HBA,
magenta represents HBD and cyan represents HY-AL features.
ings (Niu et al., 2014). Hypo 1 was developed with better
statistical values, such as higher correlation, large cost
difference, and low RMSD (1.30795). Hypo 1 has pre-
dicted the experimental activity values of training set
compounds with high correlation. All compounds in the
training set were categorized into four different groups
based on their experimental activity (IC
50
) values: most
active (IC
50
≤ 10 nM, ++++), active (10 < IC
50
≤ 200 nM,
+++), moderately active (200 < IC
50
≤ 1000 nM, ++), and
inactive (IC
50
> 1000 nM, +).
The predictive ability of Hypo 1 on training set com-
pounds is shown in (Table 2). In accordance with the
Hypo1 activity values, 15 out of 18 compounds in the
training set were predicted within their experimental
activity scale whereas compounds 10, 15, and 17 were
over estimated as active. None of the calculated error
values representing the ratio between the experimental
and predicted activity values were more than one order
of magnitude. All of the three most active compounds in
the training set were predicted very close to their activ-
ity values indicating the predictive ability of Hypo 1.
The most active compounds in training set mapped all
the features of Hypo 1 whereas the other compounds
missed at least one of the pharmacophoric features.
The pharmacophore mapping of the most active
and the least active compounds is shown in (Figure
3). Among top four hypotheses, Hypo 1 is the best
model over others which have also shown a high cor-
relation value (0.91) with HBA, HBD and HY-AL fea-
tures (Thangapandian et al., 2011b). The energy values
of the conformations of the most active compounds in
the training set used in model generation were lower in
Hypo 1 but relatively higher in Hypo 2. This analysis
also supported the reliability of Hypo 1 along with the
high correlation coef cient.
PHARMACOPHORE CROSS VALIDATION
(a) Fisher Randomization Test
The Fisher randomization test used for testifying and
validating Hypo 1 indicates that this pharmacophore
model does not occur due to the random correlation
(Singh and Singh, 2013). The experimental activities of
the training set were picked randomly and the resulting
Sudha Singh et al.
BIOSCIENCE BIOTECHNOLOGY RESEARCH COMMUNICATIONS DEVELOPMENT OF 3D QSAR BASED PHARMACOPHORE MODEL FOR NEURAMINIDASE IN INFLUENZA A VIRUS 69
training set was used in HypoGen with the parameters
chosen for the original pharmacophore generation. A set
of 19 random spread sheets was generated to achieve a
95% con dence level that the best pharmacophore Hypo
1 was not generated by chance (Sakkiah and Lee, 2012)
shown in (Table 3). None of the randomly generated
pharmacophore models during Fisher randomization
test has scored better statistical parameters than Hypo 1.
Though four random pharmacophores scored a correla-
tion value higher than 0.9 (i. e. than Hypo 1).
(b) Leave – one – out method
Leave – one - out method was used for nal validation(Niu
et al., 2013). This method is used to verify if the correla-
tion between the experimental and predicted activities
is primarily dependent on one particular molecule in
the training set, or otherwise. This is done by apply-
ing recursive iteration on the pharmacophore model by
excluding one molecule in every iteration cycle. The 18
HypoGen calculations were carried out under conditions
that were identical to the ones used in the generation of
original pharmacophore model Hypo 1. 18 new train-
ing sets, each containing 17 molecules, were derived.
The correlation coef cients of newly generated phar-
macophore models were computed. A positive result
emerges if none of the correlation coef cients of newly
generated pharmacophore models is higher or too lower
to that of Hypo 1. The ndings establish that none of
the 18 new models generated by this method has any
signi cant difference vis – a - vis Hypo 1. This result
enhances the con dence level of Hypo 1regarding the
non – dependence of correlation coef cient on any par-
ticular compound in the training set.
CONCLUSION
The present study is an attempt to generate a quantita-
tive pharmacophore model for neuraminidase enzyme
by employing a dataset of known inhibitors. A model
(Hypo 1) was developed based on the training set com-
pounds with high chemical structure diversity and sig-
ni cant divergence in biological activity values (IC
50
).
The best pharmacophore model was selected on the basis
of various parameters like cost difference, correlation co
– ef cient, and the validation results. All these valida-
tion procedures have shown and con rmed the strength
of the selected model Hypo 1. These validation results
Table 3. Fisher Randomization test results.
Validation no Total cost Null cost Cost Diff. correlation
Original hypothesis
Hypo 1 94.22 157.052 62.83 0.917666
Randomized
hypothesis
Trail 1 103.517 157.052 53.535 0.871634
Trail 2 109.558 157.052 47.494 0.854541
Trail 3 108.675 157.052 48.377 0.84838
Trail 4 107.26 157.052 49.792 0.860989
Trail 5 108.599 157.052 48.453 0.856582
Trail 6 132.103 157.052 24.949 0.655598
Trail 7 115.443 157.052 41.609 0.805429
Trail 8 112.835 157.052 44.217 0.804367
Trail 9 122.52 157.052 34.532 0.724558
Trail 10 112.816 157.052 44.236 0.885913
Trail 11 113.451 157.052 43.601 0.801793
Trail 12 115.03 157.052 42.022 0.868995
Trail 13 101.264 157.052 55.788 0.89344
Trail 14 105.574 157.052 51.478 0.919629
Trail 15 115.66 157.052 41.392 0.784862
Trail 16 110.194 157.052 46.858 0.906808
Trail 17 114.316 157.052 42.736 0.779937
Trail 18 127.639 157.052 29.413 0.780038
Trail 19 127.029 157.052 24.95 0.692584

Sudha Singh et al.
70 DEVELOPMENT OF 3D QSAR BASED PHARMACOPHORE MODEL FOR NEURAMINIDASE IN INFLUENZA A VIRUS BIOSCIENCE BIOTECHNOLOGY RESEARCH COMMUNICATIONS
throw interesting opportunities for further database
screening to identify the small molecule which can be
used in neuraminidase inhibitor design and may provide
leads in the world’s ght against In uenza A Virus.
ACKNOWLEDGEMENT
The authors are thankful to Maulana Azad National
Institute of Technology (MANIT), Bhopal, and MHRD,
GOI, for providing nancial assistance. Special thanks
are due to Dr. Ajay Pandey, a faculty member at MANIT,
Bhopal, for his valuable support, help, and guidance
during the preparation of this manuscript.
CONFLICT OF INTEREST
The authors declare that they have no con ict of
interest.
REFERENCES
Arooj, M., Sakkiah, S., Kim, S., Arulalapperumal, V. and Lee,
K. W. (2013): A combination of receptor-based pharmacophore
modeling & QM techniques for identi cation of human chy-
mase inhibitors. PLoS One, 8(4), pp. e63030.
Bharatham, N., Bharatham, K. and Lee, K. W. (2007): Phar-
macophore identi cation and virtual screening for methionyl-
tRNA synthetase inhibitors. Journal of Molecular Graphics and
Modelling, 25(6), pp. 813-823.
Burch, J., Corbett, M., Stock, C., Nicholson, K., Elliot, A. J.,
Duffy, S., Westwood, M., Palmer, S. and Stewart, L. (2009): Pre-
scription of anti-in uenza drugs for healthy adults: a system-
atic review and meta-analysis. The Lancet infectious diseases,
9(9), pp. 537-545.
Colman, P. M. (1989): ‘Neuraminidase’, The in uenza viruses.
Springer, pp. 175-218.
De Clercq, E. (2001): Antiviral drugs: current state of the art.
Journal of Clinical Virology, 22(1), pp. 73-89.
de Jong, M. D., Ison, M. G., Monto, A. S., Metev, H., Clark, C.,
O’neil, B., Elder, J., McCullough, A., Collis, P. and Sheridan, W.
P. (2014): Evaluation of intravenous peramivir for treatment of
in uenza in hospitalized patients. Clinical Infectious Diseases,
59(12), pp. e172-e185.
Ducatez, M. F., Pelletier, C. and Meyer, G. (2015): In uenza D
virus in cattle, France, 2011–2014. Emerging infectious dis-
eases, 21(2), pp. 368.
Ferguson, L., Eckard, L., Epperson, W. B., Long, L.-P., Smith,
D., Huston, C., Genova, S., Webby, R. and Wan, X.-F. (2015):
In uenza D virus infection in Mississippi beef cattle. Virology,
486, pp. 28-34.
Gong, J., Xu, W. and Zhang, J. (2007): Structure and functions
of in uenza virus neuraminidase. Current medicinal chemistry,
14(1), pp. 113-122.
Hastings, J., Selnick, H., Wolanski, B. and Tomassini, J. (1996):
Anti-in uenza virus activities of 4-substituted 2, 4-dioxobuta-
noic acid inhibitors. Antimicrobial agents and chemotherapy,
40(5), pp. 1304-1307.
Hata, A., Akashi-Ueda, R., Takamatsu, K. and Matsumura, T.
(2014): Safety and ef cacy of peramivir for in uenza treat-
ment. Drug design, development and therapy, 8, pp. 2017.
Hay, A., Wolstenholme, A., Skehel, J. and Smith, M. H. (1985):
The molecular basis of the speci c anti-in uenza action of
amantadine. The EMBO journal, 4(11), pp. 3021.
John, S., Thangapandian, S., Sakkiah, S. and Lee, K. W. (2010):
Identi cation of potent virtual leads to design novel indoleam-
ine 2, 3-dioxygenase inhibitors: Pharmacophore modeling and
molecular docking studies. European journal of medicinal
chemistry, 45(9), pp. 4004-4012.
Kandakatla, N. and Ramakrishnan, G. (2014): Ligand based
pharmacophore modeling and virtual screening studies to
design novel HDAC2 inhibitors. Advances in bioinformatics,
2014.
Kansal, N., Silakari, O. and Ravikumar, M. (2010): Three dimen-
sional pharmacophore modelling for c-Kit receptor tyrosine
kinase inhibitors. European journal of medicinal chemistry,
45(1), pp. 393-404.
Kobasa, D., Takada, A., Shinya, K., Hatta, M., Halfmann, P.,
Theriault, S., Suzuki, H., Nishimura, H., Mitamura, K. and
Sugaya, N. (2004): Enhanced virulence of in uenza A viruses
with the haemagglutinin of the 1918 pandemic virus. Nature,
431(7009), pp. 703-707.
Kurogi, Y. and Guner, O. F. (2001): Pharmacophore modeling
and three-dimensional database searching for drug design using
catalyst. Current medicinal chemistry, 8(9), pp. 1035-1055.
Li, C., Fang, J. S., Lian, W. W., Pang, X. C., Liu, A. L. and Du,
G. H. (2015): In vitro antiviral effects and 3D QSAR study of
resveratrol derivatives as potent inhibitors of in uenza H1N1
neuraminidase. Chemical biology & drug design, 85(4), pp.
427-438.
Mammen, M., Dahmann, G. and Whitesides, G. M. (1995):
Effective inhibitors of hemagglutination by in uenza virus
synthesized from polymers having active ester groups. Insight
into mechanism of inhibition. Journal of medicinal chemistry,
38(21), pp. 4179-4190.
Muthusamy, K., Kirubakaran, P., Krishnasamy, G. and Thana-
shankar, R. R. (2015): Computational Insights into the Inhi-
bition of In uenza Viruses by Rupestonic Acid Derivatives:
Pharmacophore Modeling, 3D-QSAR, CoMFA and COMSIA
Studies. Combinatorial chemistry & high throughput screen-
ing, 18(1), pp. 63-74.
Nayak, B., Kumar, S., DiNapoli, J. M., Paldurai, A., Perez, D.
R., Collins, P. L. and Samal, S. K. (2010): Contributions of the
avian in uenza virus HA, NA, and M2 surface proteins to the
induction of neutralizing antibodies and protective immunity.
Journal of virology, 84(5), pp. 2408-2420.
Neves, M. A., Dinis, T. C., Colombo, G. and e Melo, M. L. S.
(2009): An ef cient steroid pharmacophore-based strategy to

Sudha Singh et al.
BIOSCIENCE BIOTECHNOLOGY RESEARCH COMMUNICATIONS DEVELOPMENT OF 3D QSAR BASED PHARMACOPHORE MODEL FOR NEURAMINIDASE IN INFLUENZA A VIRUS 71
identify new aromatase inhibitors. European journal of medic-
inal chemistry, 44(10), pp. 4121-4127.
Niu, M.-m., Qin, J.-y., Tian, C.-p., Yan, X.-f., Dong, F.-g.,
Cheng, Z.-q., Fida, G., Yang, M., Chen, H. and Gu, Y.-q. (2014):
Tubulin inhibitors: pharmacophore modeling, virtual screen-
ing and molecular docking. Acta Pharmacologica Sinica, 35(7),
pp. 967-979.
Niu, M., Dong, F., Tang, S., Fida, G., Qin, J., Qiu, J., Liu, K., Gao,
W. and Gu, Y. (2013): Pharmacophore modeling and virtual
screening for the discovery of new type 4 cAMP phosphodies-
terase (PDE4) inhibitors. PloS one, 8(12), pp. e82360.
Rajao, D. S. and Vincent, A. L. (2015): Swine as a model for
in uenza a virus infection and immunity. ILAR Journal, 56(1),
pp. 44-52.
Renzette, N., Caffrey, D. R., Zeldovich, K. B., Liu, P., Gallagher,
G. R., Aiello, D., Porter, A. J., Kurt-Jones, E. A., Bolon, D.
N. and Poh, Y.-P. (2014): Evolution of the in uenza A virus
genome during development of oseltamivir resistance in vitro.
Journal of virology, 88(1), pp. 272-281.
Ryan, D. M., Ticehurst, J. and Dempsey, M. H. (1995): GG167
(4-guanidino-2, 4-dideoxy-2, 3-dehydro-N-acetylneuraminic
acid) is a potent inhibitor of in uenza virus in ferrets. Antimi-
crobial agents and chemotherapy, 39(11), pp. 2583-2584.
Sakkiah, S. and Lee, K. W. (2012): Pharmacophore-based vir-
tual screening and density functional theory approach to iden-
tifying novel butyrylcholinesterase inhibitors. Acta Pharmaco-
logica Sinica, 33(7), pp. 964-978.
Sanam, R., Vadivelan, S., Tajne, S., Narasu, L., Rambabu, G.
and Jagarlapudi, S. A. (2009): Discovery of potential ZAP-70
kinase inhibitors: Pharmacophore design, database screening
and docking studies. European journal of medicinal chemistry,
44(12), pp. 4793-4800.
Sarma, R., Sinha, S., Ravikumar, M., Kumar, M. K. and
Mahmood, S. (2008): Pharmacophore modeling of diverse
classes of p38 MAP kinase inhibitors. European journal of
medicinal chemistry, 43(12), pp. 2870-2876.
Schomburg, I., Chang, A., Ebeling, C., Gremse, M., Heldt, C.,
Huhn, G. and Schomburg, D. (2004): BRENDA, the enzyme
database: updates and major new developments. Nucleic acids
research, 32(suppl 1), pp. D431-D433.
Schuster, D., Laggner, C., Steindl, T. M., Palusczak, A., Hart-
mann, R. W. and Langer, T. (2006): Pharmacophore modeling
and in silico screening for new P450 19 (aromatase) inhibi-
tors. Journal of chemical information and modeling, 46(3), pp.
1301-1311.
Singh, A. and Singh, R. (2013): QSAR and its role in tar-
get-ligand interaction. Open Bioinformatics Journal, 7, pp.
63-67.
Stoll, F., Liesener, S., Hohlfeld, T., Schrör, K., Fuchs, P. L. and
Höltje, H.-D. (2002): Pharmacophore de nition and three-
dimensional quantitative structure-activity relationship study
on structurally diverse prostacyclin receptor agonists. Molecu-
lar pharmacology, 62(5), pp. 1103-1111.
Sundarapandian, T., Shalini, J., Sugunadevi, S. and Woo, L.
K. (2010): Docking-enabled pharmacophore model for histone
deacetylase 8 inhibitors and its application in anti-cancer drug
discovery. Journal of Molecular Graphics and Modelling, 29(3),
pp. 382-395.
Thangapandian, S., John, S., Sakkiah, S. and Lee, K. W. (2011a):
Pharmacophore-based virtual screening and Bayesian model
for the identi cation of potential human leukotriene A4
hydrolase inhibitors. European journal of medicinal chemistry,
46(5), pp. 1593-1603.
Thangapandian, S., John, S., Sakkiah, S. and Lee, K. W. (2011b):
Potential virtual lead identi cation in the discovery of renin
inhibitors: Application of ligand and structure-based pharma-
cophore modeling approaches. European journal of medicinal
chemistry, 46(6), pp. 2469-2476.
Varghese, J. and Colman, P. M. (1991): Three-dimensional
structure of the neuraminidase of in uenza virus A/Tokyo/3/67
at 2· 2 Å resolution. Journal of molecular biology, 221(2), pp.
473-486.
Vuorinen, A., Engeli, R., Meyer, A., Bachmann, F., Griesser, U.
J., Schuster, D. and Odermatt, A. (2014): Ligand-based phar-
macophore modeling and virtual screening for the discovery of
novel 17-hydroxysteroid dehydrogenase 2 inhibitors. Journal
of medicinal chemistry, 57(14), pp. 5995-6007.
Zampieri, D., Mamolo, M. G., Laurini, E., Florio, C., Zanette,
C., Fermeglia, M., Posocco, P., Paneni, M. S., Pricl, S. and Vio,
L. (2009): Synthesis, biological evaluation, and three-dimen-
sional in silico pharmacophore model for 1 receptor ligands
based on a series of substituted benzo [d] oxazol-2 (3 H)-one
derivatives. Journal of medicinal chemistry, 52(17), pp. 5380-
5393.