
Agricultural
Communication
Biosci. Biotech. Res. Comm. 10(3): 504-513 (2017)
Effect of water stress on gland function and some
qualitative traits of commercial cultivars and promising
potato clones
M. Ziachehreh
1
*, A. Tobeh
2
, D. Hassanpanah
3
, Sh. Jamaati
4
and Y. Jahani
5
1
MSc Student of Agronomy, University of Mohaghegh Ardabili, Ardabil, Iran
2
Associate Professor, Departmant Agronomy, University of Mohaghegh Ardabili, Ardabil, Iran
3
Assistant Professor Ardabil Agriculture and Natural Resources Research and Education Centre (Moghan),
Ardabil, Iran
4
Young Researchers Club, Ardabil Branch, Islamic Azad University, Ardabil, Iran
5
Researcher, Ardabil Agriculture and Natural Resources Research and Education Centre (Moghan), Ardabil, Iran
ABSTRACT
In order to evaluate the effect of water stress on gland function and some of qualitative traits of commercial cultivars and
potato clone, the experiment was performed as split-plot design based on randomized complete blocks with 3 replications
in agricultural research and education station and natural resources of Ardabil in 2015. In order to determine the tolerance
of cultivars and clone against water stress, susceptibility indexes and tolerance against water stress were used. The results
of analysis of variance showed that the traits of total gland function, gland protein function, and percentage of dry mat-
ter of the gland, under the effect of irrigation levels and all traits of interest, became signi cant under the main effect of
genotype. Also, the interaction of irrigation levels and cultivar was signi cant for the percentage of the dry matter of the
gland. In this study, substituting moderate water stress for normal irrigation lead to about 27% saving on irrigation water
consumption. Agria and Marfona cultivars produced highest percentage and function of protein and gland methionine.
Clone 397008-9 showed the highest function of total gland and according to GMP, MP, and SSI indexes, had higher toler-
ance threshold relative to water stress. Also, Agria and Spirit cultivars had highest percentage of dry matter in severe and
moderate water stress, respectively. STI showed signi cant superiority in identifying resistant genotypes.
KEY WORDS: TOLERANCE INDEX, PROTEIN FUNCTION, DRY MATTER, METHIONINE
504
ARTICLE INFORMATION:
*Corresponding Author:
Received 10
th
June, 2017
Accepted after revision 13
th
Sep, 2017
BBRC Print ISSN: 0974-6455
Online ISSN: 2321-4007 CODEN: USA BBRCBA
Thomson Reuters ISI ESC and Crossref Indexed Journal
NAAS Journal Score 2017: 4.31 Cosmos IF: 4.006
© A Society of Science and Nature Publication, 2017. All rights
reserved.
Online Contents Available at:
http//www.bbrc.in/
DOI: 10.21786/bbrc/10.3/25

Ziachehreh et al.
INTRODUCTION
Potato (Solanum tuberosum L.) is a one-year plant from
Solananceae family and after corn, rice, and wheat, is in
the fourth place in global scale. In this scale, Iran is in
the twelfth place regarding potato production and in the
Asia, is in the third place, so that the cultivation area of
this product during 92-93 was 159000 hectares (FAQ,
2014). Since the provision of food necessitates maximum
utilization of limited resources, therefore, awareness of
factors that in uence the function of each plant and its
effect on increased agricultural plants function is very
important. Also, its provision is an important factor in
increasing the quality and quantity of crops, especially
potato. Water stress is one of the most important factors
that limits crops production (Passioura, 2007). Numerous
studies have shown that potato has high susceptibility to
water stress in all stages (Rezazadeh et al., 2015; Shock
et al., 2013, Li et al., 2016).
The results of studies by Haghighi et al. (2015)
showed that the effect of water stress treatments on
gland function is signi cant and with increased irriga-
tion water, the function increases. Water stress has a
direct effect on proteinizaton process and water short-
age in plant, in addition to hydrolyzing the available
proteins, stops synthesis of new proteins (Kazemi, 1994).
Since the function of crops under stress condition, due
to genotype and environmental effects, is not considered
as a suitable benchmark to select genotypes resistant
against drought, various indexes are proposed to select
plants based on function. In investigating the tolerance
of water de cit under in vitro and in vivo conditions,
Hasanpanah (2010), based on MP, GMP, STI, and MSTI,
selected Kaiser as the superior cultivar under normal
and water stress conditions. Since a major part of lands
are under arid and semi-arid conditions and rainfall are
decreased in recent years, potato production has been
faced by numerous problems. Therefore, accurate analy-
sis as well as qualitative and quantitative assessments
and determining to tolerance and susceptibility against
water in different growth stages constitute one of the
most important methods to decrease concerning effects
of water de cit. Therefore, this study aimed to use tol-
erance and susceptibility against water stress in farm
conditions.
MATERIAL AND METHODS
This study was conducted during 2014-2015 in agri-
cultural research and education station and natural
resources of Ardabil. Ardabil province has moderate
and semi-temperate climate with very cool winters and
springs and moderate summers. Average maximum and
minimum annual temperature and maximum regional
temperature were 19.8, 15.18, and 21.58, respectively.
Also, average rainfall has been reported as 310 mm
(Unknown, 2016). Soil properties of the area are pre-
sented in Table (1).
The experiment was performed as split-plot design
based on randomized complete blocks with 3 replica-
tions. Irrigation as the main plot was considered with
three levels including provision of 100% water needs
(control treatment), moderate water stress, and severe
water stress. Also, cultivar was considered as the minor
plot at six levels including Agria , Spirit, Marfona ,
Luca, Hermes, and promising clone. In the autumn
of 2014, land preparation operation was performed
as deep plowing, disc cutting, and land levelling the
farm. At the beginning of May, stacking and plotting
operation was performed and glands were cultivated.
Treatments were implemented in experimental plots
with the area of 22.5 square meter consisted of four
6-meter lines with the distances of 75 cm between two
rows and 25 cm between two bushes. To prevent water
penetration from adjacent plots, 3 m and 1.5 m were
considered between the main plot and the minor plots
as margin. To control Colorado beetle pest, con dorous
pesticide (250 ml) was used before owering of potato.
Also, to prevent whippery, mancozeb was used (1 kg/
ha) before owering stage. According to the results of
soli analysis in the area of interest, 150 kg/ha ammo-
nium phosphate was used in two turns (50% while cul-
tivation and 50% in gland formation), urea (350 kg/
ha) in three turns (25% while cultivation, 50% while
emergence, and 25% immediately after gland forma-
tion), and potassium sulfate (150 kg) in one turn (cul-
tivation). Weed practices were performed in two turns
before gland formation in all experimental plots. In
Ardabil and neighborhood areas, water stress mainly
occurs in July and August and for this reason, the pur-
pose is to identify cultivars that are resistant against
stress in the nal tension of the season. The implemen-
tation of irrigation treatments was as follow:
Normal irrigation treatment was initiated one day
after gland cultivation (Juan 6) and continued until
October, 2 (harvesting) that was accompanied by two
irrigations (5-7 days) with providing 100% water needs
of the plant. In the plots under this treatment, irrigation
times from cultivation to harvesting, included 11 times
and water volume and applied water were 10950 and
11638 cubic meter, respectively.
Moderate water stress treatment was initiated one
day after gland cultivation (Juan 6) and continued until
July, 2 with irrigation period of 5-7 days and provi-
sion of 100% water need. Then, the irrigation operation
stopped after 15 days (two times of irrigation). After this
period, irrigation operation followed normal condition
until October, 2 with the provision of 100% water need.
BIOSCIENCE BIOTECHNOLOGY RESEARCH COMMUNICATIONS EFFECT OF WATER STRESS ON GLAND FUNCTION 505

Ziachehreh et al.
Therefore, in the plots of this treatment, the number of
irrigations until cultivation was 9 and water volume and
applied water were estimated as 8040 and 8728 cubic
meter, respectively. Severe water stress was initiated one
day after cultivation (Juan 6) and continued until July,
2 with the provision of 100% water need and irrigation
period of 5-7 days in normal condition. Then, the irriga-
tion operation continued until October, 2 win normal
condition and provision of 100% water need. Therefore,
in the plots of this treatment, the number of irrigations
was 7 and irrigation water and applied water were 6600
and 7288 cubic meter, respectively.
The initiation of irrigation in the farm of interest in
climatic condition of Ardabil was estimated based on
evaporation of 28 mm water from pan evaporation sur-
face (40% humidity discharge of available water). In
other words, to estimate water in experimental plots,
data related to evaporation from pan evaporation (Class
A) were used. Also, Relationship (1) was used to estimate
the required water for normal irrigation treatment (pro-
vision of 100% required water).
Relationship 1: S × EP × 8/0 = IW
Here, IW is required water (cubic meter), 0.8 is pan
coef cient (Moradi et al., 2000), EP is evaporation from
pan evaporation (mm), and S is the area of experimental
plot (square meter). Then, in each irrigation turn, the
required water for plots was estimated and directed to
the plots of interests. Irrigation operation was performed
for all plots until 75 days after cultivation and after that,
moderate and severe water stresses were implemented.
To measure daily precipitation, rainfall meter device was
installed at the pan evaporation and each day in certain
time (12 PM), measurements were performed. Compari-
son of the water required for each treatment and rainfall
has been presented in Table (2).
Harvesting was performed by Octoer, 2. For this pur-
pose, by the end of the season, to measure gland func-
tion, sampling was done for 2 central row in each plot
(5 m) and to remove marginal effects, to marginal rows
were removed. Then, the harvested glands from each
surface (5 ×1.5m) were weighted and the resulted num-
ber was determined as the total gland function at the
surface level (hectares). To determine the dry matter per-
centage of the glands, rst, 10 glands were randomly
selected and from each samples, 200g was sliced and
after placing them within paper envelopes, they were
placed inside the oven for 48h at the temperature of 72
C (Hasanpanah & Hoseinzadeh, 2007). After this period,
samples were weighted by digital balance and the dry
matter percentage was estimated using Relationship (2):
Relationship 2: dry matter percentage – (gland weight
after drying/initial weight of glands) ×100
The multiplication of gland dry matter percentage
and gland function has been considered as the gland dry
matter function in hectares. To determine the weight of
gland protein, Bradford method (1976) was used and to
estimate protein function, relationship (3) was used:
Relationship 3: gland function×100/gland protein per-
centage – protein function. Also, methionine function
(having data related to gland protein percentage and
function) was estimated using Relationship (4):Relation-
ship 4: methionine function - protein function×gland
methionine percentage/100
In this study, after harvesting and estimating geno-
types in both stress and normal conditions, ve main
indexes were used to determine tolerance and suscepti-
bility of genotypes against water stress. To de ne differ-
ent indexes, following terms have been used:
Yp: potential function of each genotype in stress-
free environment
Ys: potential function of each genotype in stress
environment
Y
ˉ
p: average function of all genotypes in stress-
free environment
Y
ˉ
s: average function of all genotypes in stress
environment
Stress Susceptibility Index (SSI) was proposed by Fischer
and Mourer (1978) as follow:
Relationship 5: SSI = [1- (Ys /Yp)] /SI
In this relationship, SI is estimated as follow:
SI =1- (Y
ˉ
s/Y
ˉ
p)
In genotype assessment using SSI, higher value of the
index shows genotype susceptibility to stress. Therefore,
genotype selection should be based on low SSI values.
Tolerance index (TOL) was de ned Roseili and Ham-
bline (1981) as function disorder in stress and stress-free
environments:
Relationship 6: TOL = Yp – Ys
In genotype assessment using this index, higher index
value shows susceptibility to stress; therefore, genotype
selection should be based on low value of TOL.
Mean Productivity (MP) that was proposed by Ros-
ielle and Hamblin (1981) as follow:
Relationship (7): MP = (YS + YP)/2
This index in the mean of genotype utilization in stress
and stress-free conditions and selects genotypes that
have high function in desirable conditions, but are in
undesirable condition in term of function. Therefore,
506 EFFECT OF WATER STRESS ON GLAND FUNCTION BIOSCIENCE BIOTECHNOLOGY RESEARCH COMMUNICATIONS
Ziachehreh et al.
BIOSCIENCE BIOTECHNOLOGY RESEARCH COMMUNICATIONS EFFECT OF WATER STRESS ON GLAND FUNCTION 507
selection based in MP index is ef cient for genotypes
with high potential.
Stress tolerance Index (STI) is estimated by Relation-
ship (8) and Geometric Mean Productivity (GMP) is esti-
mated by Relationship (9):
To perform statistical analyses and data estimations such
as analysis of variance, correlation coef cient between
assessment characteristics, and estimating tolerance
indexes, SAS 9.1 was used. Also, to compare means, LSD
test at the probability level of 5% was used.
levels and cultivars at the probability levels of 5% and
1% while the interaction of these two factors did not
show any signi cant difference (Table 4). Comparison of
total gland function at different irrigation levels showed
that normal irrigation treatment has highest function at
the surface level (31290 kg/ha). Also, moderate water
stress was placed in mutual statistical group and showed
a signi cant difference with severe water stress treat-
ment (Table 5).
According to the economic importance of gland
function as well as difference in two irrigation rounds
between normal irrigation and moderate water stress, it
seems that the implementation of moderate water stress
in potato farms and replacing it by normal irrigation
method, in addition to obtaining suitable total function,
leads to relative saving on water consumption. Signi -
cance of the difference between genotypes shows the
variety of genetic materials for the trait of interest, so
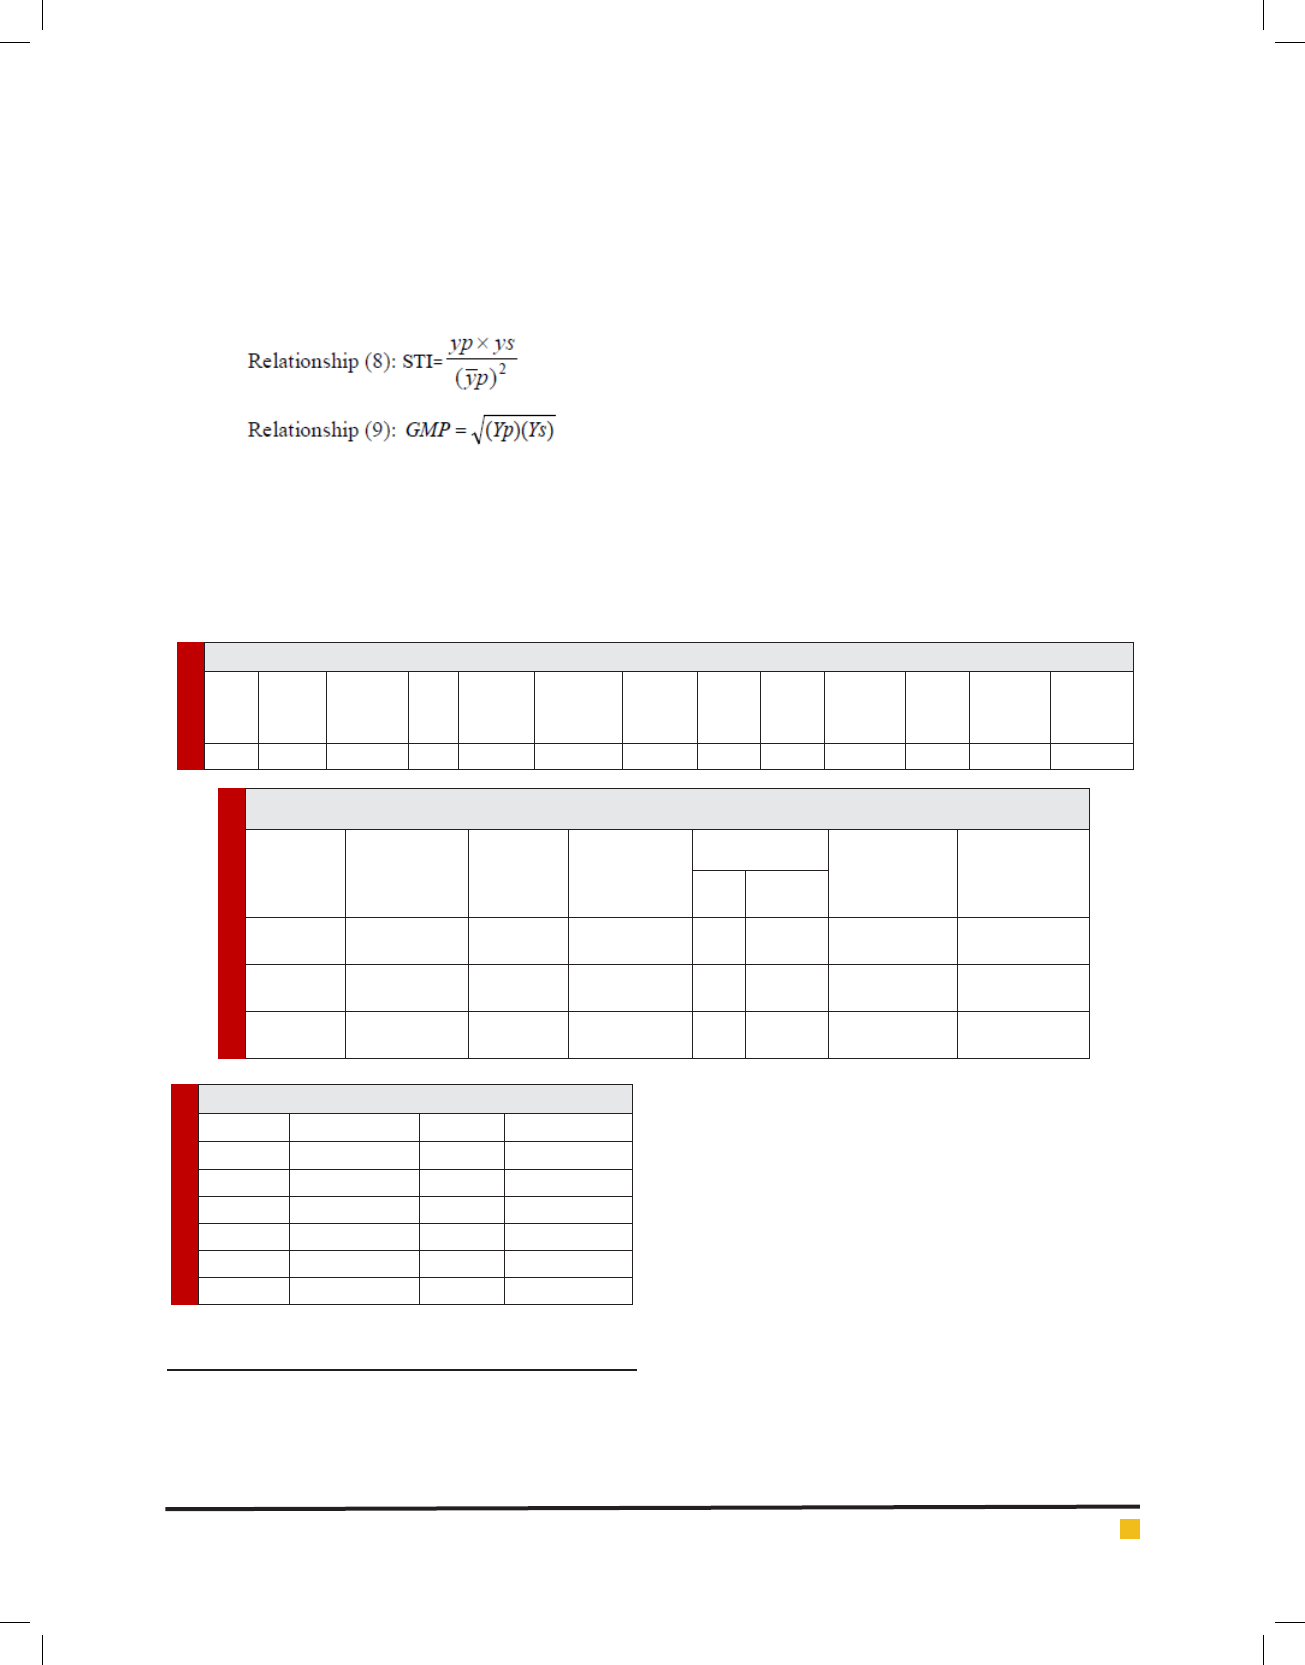
Table 1. Soil test results at the depth of 0 to 30 cm
Soil
texture
Saturated
moisture
content
Electrical
conductivity
pH
Organic
carbon
percentage
Total
percentage of
neutralizing
material
Total
nitrogen
percentage
Zinc
(mg/kg)
Iron
(mg/kg)
Manganese
(mg/kg)
Copper
(mg/kg)
Absorbable
potassium
(mg/kg)
Absorbable
phosphorus
(mg/kg)
Lumi 43 0.874 0.797 1.03 6.5 0.1 10.1 5.18 16.2 7.52 318 5.8
Table 2. Comparing irrigation water volume of experimental plots
Treatment
Irrigation
rounds (day)
Number of
irrigations
Irrigation
volume (cubic
meter/ha)
Rainfall
Effective
rainfall (cubic
meter/ha)
Applied water
volume (cubic
meter/ha)
mm
Cubic
meter/ha
Normal
irrigation
5-7 11 10950 86 860 688 11638
Moderate
stress
5-7 9 8040 86 860
688
8728
Severe
stress
5-7 7 6600 86 860
688
7288
Table 3. Rainfall statistics of the area in 2015
Month Rainfall (mm) Month Rainfall (mm)
April 35.7 October 58.3
May 26.5 November 46.6
Juan 7 December 13.9
July 3.6 January 6.4
August 0 February 24.9
September 48.9 March 36.7
RESULTS AND DISCUSSION
TOTAL GLAND FUNCTION
The results of analysis of variance for this trait showed
that there is a signi cant difference between irrigation
that the promising clone 397008-9 with including Agria,
Spirit, Marfona, Luca, and Hermes shows the highest
gland function mean and signi cant different with other
cultivars. Also, Spirit and Hermes cultivars produced
minimum total mean of gland function (Table 6).
Correlation coef cient table showed that total gland
function has a positive and signi cant correlation
with most of traits (Table 8). In moderate and severe
water stress, a signi cant and positive correlation was
observed between total gland function and gland protein
function (Tables 9 and 10). Also, a signi cant and posi-
tive correlation was observed between gland dry matter
and total gland function under moderate water stress.
Also, in moderate water stress, MP and GMP, in addition
to having signi cant and positive correlation with each
other, showed the same correlation with STI (Table 11).
Ziachehreh et al.
508 EFFECT OF WATER STRESS ON GLAND FUNCTION BIOSCIENCE BIOTECHNOLOGY RESEARCH COMMUNICATIONS
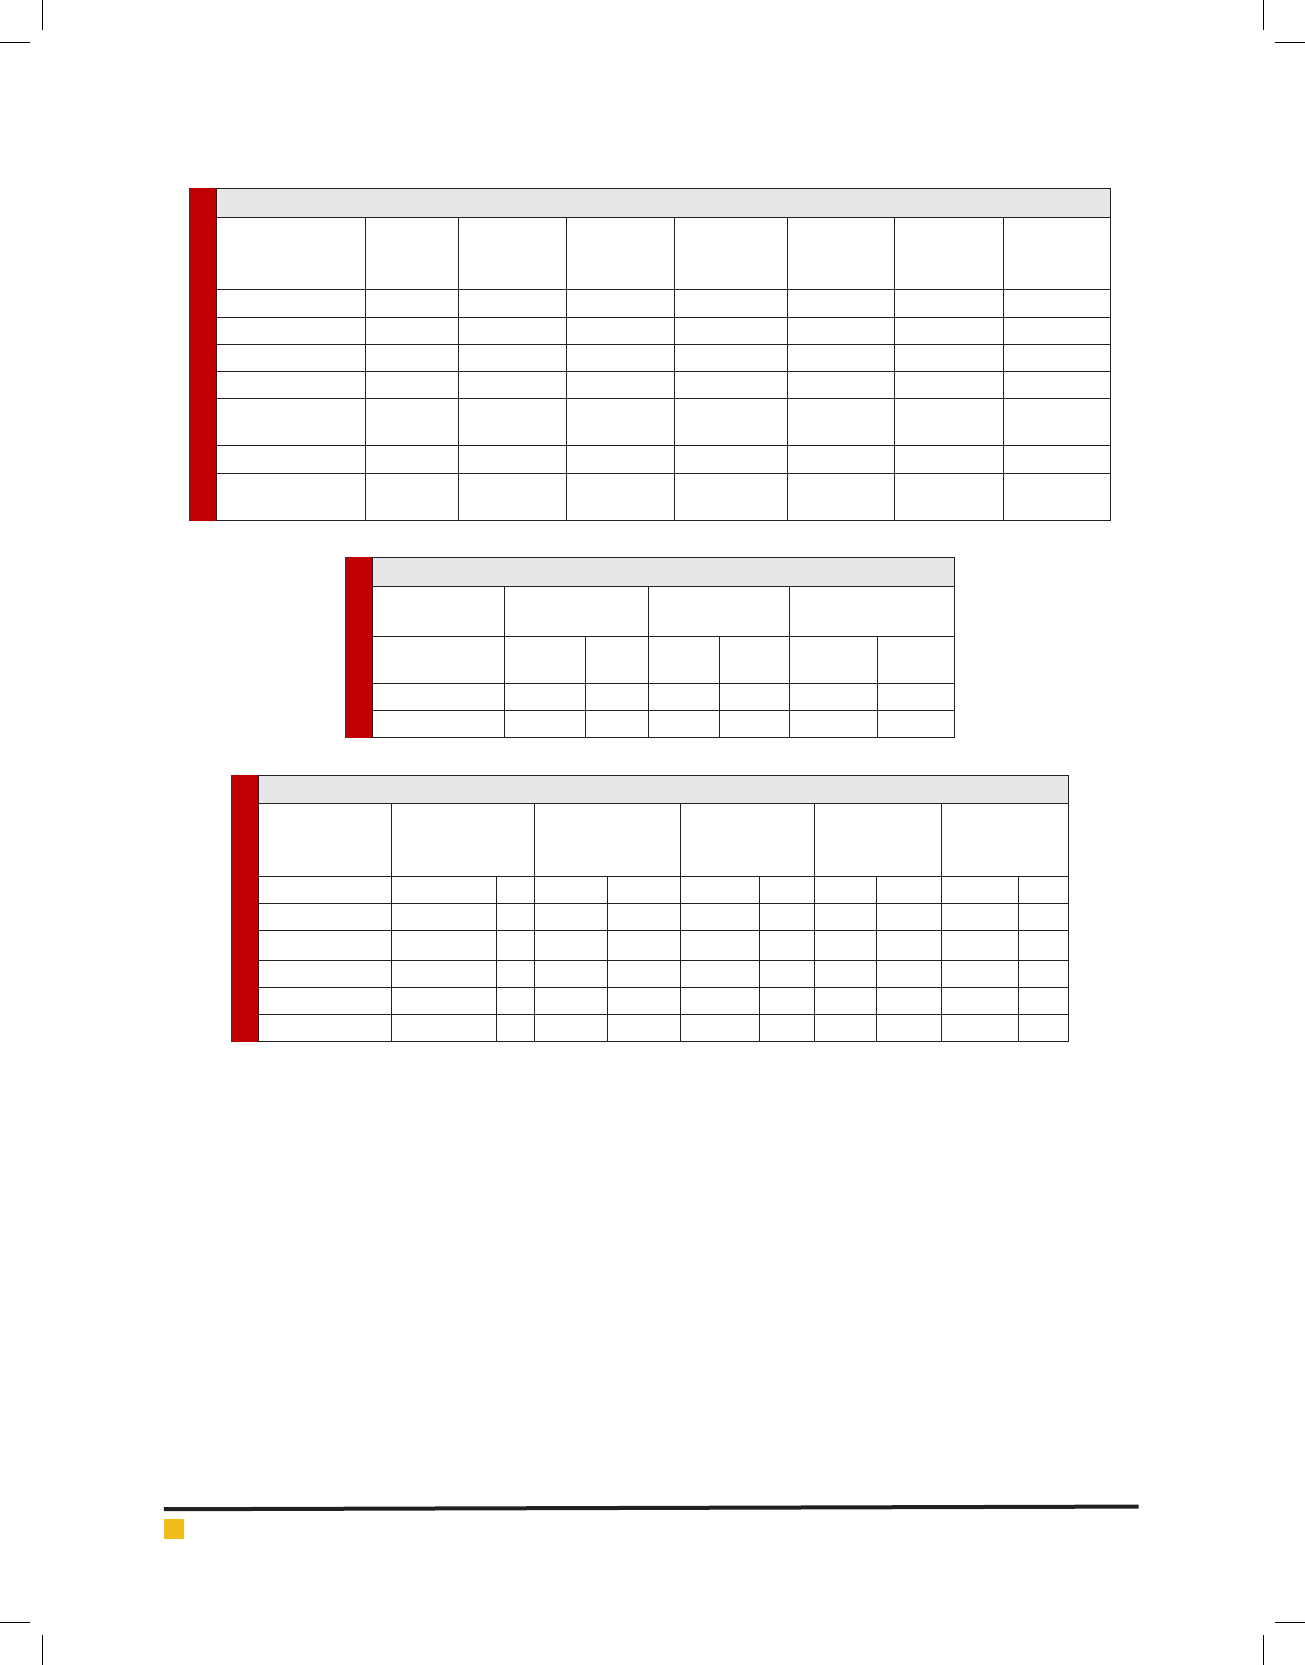
Table 4. Square mean of traits in potato cultivars and irrigation levels
Change sources
Degree of
freedom
Total gland
function
Gland
protein
percentage
Gland
protein
function
Gland dry
matter
percentage
Gland dry
matter
function
Gland
methionine
value
Replication 2 206.37 0.0003 2959.44 0.69 8.72 0.002
Irrigation levels 2 118.34* 0.00794** 619.92** 22.14** 1.02ns 0.00032ns
False 4 31.94 0.00017 330.04 0.43 1.11 0.002
Genotype 5 316.87** 0.01003** 4471.16** 26.32** 18.82** 0.032**
Cultivars ×
irrigation levels
10 35.83ns 0.00014ns 471.88ns 3.46** 1.36ns 0.001ns
False 30 41.15 0.0002 584.72 0.53 1.44 0.003
Change percentage
(%)
22.59 3.99 23.38 3.75 21.59 29.10
Table 5. Comparing the mean of irrigation levels on some of potato traits
Gland total
function (kg/ha)
Gland protein
percentage (%)
Gland protein
function (kg/ha)
Irrigation
levels
a
31290
b3.4b190.01
Normal
irrigation
ab27590a3.76a205.71Moderate stress
b26320a3.7b192.14Severe stress
Table 6. Comparing the mean of cultivar on some of potato traits
Gland
function
(kg/ha)
Gland protein
percentage
(%)
Gland protein
function
(kg/ha)
Gland dry
matter function
(kg/ha)
Gland
methionine
(microgram/mg)
Cultivars
a29647a4a253.21a6240a0.25Agria
a32403a4a252.46a6930a0.25Marfona
a33100b3.6a230.81a6370b0.16
Luca
b22790d3.2b146.65b3900b0.12Spirit
b19303c3.4b119.95b3540b0.14Hermes
a33110b3.6a229.21a6360a0.23Clone 379008-9
In severe water stress, MP and GMP showed a signi -
cant and positive correlation at the probability level of
5% with STI and under these circumstances and proba-
bility level of 1%, a signi cant and positive relationship
was observed between MP and GMP (Table 12). Accord-
ing to the table of simple coef cients between indexes,
correlation between potential function and stress in
moderate stress (r=0.893) and severe stress (r=0.937) was
signi cant (Table 13 and 14). The function of genotypes
in stress-free environment showed a positive correlation
with STI, MP, and GMP. Also, correlation between the
function of genotypes under moderate water stress and
STI, MP, and GMP as well as under severe water stress
with STI, MP, GMP, and TOL was positive. High correla-
tion between STI and genotype function in stress and
stress-free environments shows superiority of this index
relative to the indexes of interest in the assessment of
genetic variety and screening tolerant genotypes as
well as estimation of function resistance. Maralian et al.
(2014) investigated the effect of low irrigation of gland
function of different potato genotypes and found that
60% provision of water leads to decreased gland func-
tion of potato genotypes from 754 g to 640 g (17.7%).
GLAND PROTEIN PERCENTAGE
The results of analysis of variance showed that there
is a signi cant difference between different irrigation
levels and cultivars at the probability level of 1% while
no signi cant difference was observed in the interaction
of these two factors for the traits of interest (Table 4).
Comparing gland protein percentage at irrigation levels
showed that moderate and severe water stress treatment
have highest mean of gland protein percentage and
Ziachehreh et al.
BIOSCIENCE BIOTECHNOLOGY RESEARCH COMMUNICATIONS EFFECT OF WATER STRESS ON GLAND FUNCTION 509
showed a signi cant difference with normal irrigation
(Table 5). It seems that high values of protein in water
stress treatments is the result of low gland function. Sig-
ni cance of the difference between genotypes showed
genetic variation for traits, so that Agria and marfona
cultivars showed highest percentage of gland protein
(4%) and signi cant difference with other cultivars. Also,
the lowest gland protein percentage mean belonged to
Spirit (Table 6). Correlation coef cients between assess-
ment characteristics in normal irrigation showed that
protein percentage has a signi cant and positive cor-
relation with most of traits (Table 8). Also, although no
positive and signi cant correlation was observed with
other traits, under severe water stress, methionine level
and gland dry matter percentage showed signi cant and
positive correlation at the probability levels of 1% and
5% with traits (Tables 9 and 10). With increased water
stress severity, protein percentage increases; therefore,
change in protein structure or its destruction is one of
the metabolic stages that may be in uenced by water
stress (Ommen, 1999).
GLAND PROTEIN FUNCTION
The results of analysis of variance for this trait showed
that there is a signi cant relationship between irriga-
tion levels and cultivars at the probability level of 1%
while no signi cant relationship was observed in the
interaction between these factors (Table 4). According
to the comparison between protein function mean at the
irrigation level, moderate water stress showed the high-
est gland protein function (205.71 kg/ha) and showed a
signi cant difference with normal irrigation and severe
water stress. Lowest gland protein function was observed
under normal irrigation condition and severe water
stress (Table 5). In other words, by replacing moderate
water stress with normal irrigation, about 27% of water
consumption was saved. Signi cant difference between
genotypes showed genetic variety between cultivars.
Comparing the effect of genotype on gland protein
function showed that the highest mean of gland protein
function is related to Agria , Marfona , Luca, and prom-
ising clone 379008-9. Lowest mean of protein function
at the surface level belonged to Spirit and Hermes (Table
6). Correlation coef cient table about traits in normal
irrigation showed that gland protein function has a sig-
ni cant and positive relationship with most of traits
(Table 8). Also, under moderate and severe stress condi-
tions, signi cant and positive correlation was observed
between this trait and gland function. Moreover, the
trait and gland dry matter function in moderate and
severe water stress conditions showed signi cant and
positive correlation at the probability levels of 5% and
1% (Tables 9 and 10).
GLAND DRY MATTER PERCENTAGE
The results of analysis of variance showed that there is
a signi cant different between different moisture con-
tents, cultivars, and interaction between irrigation lev-
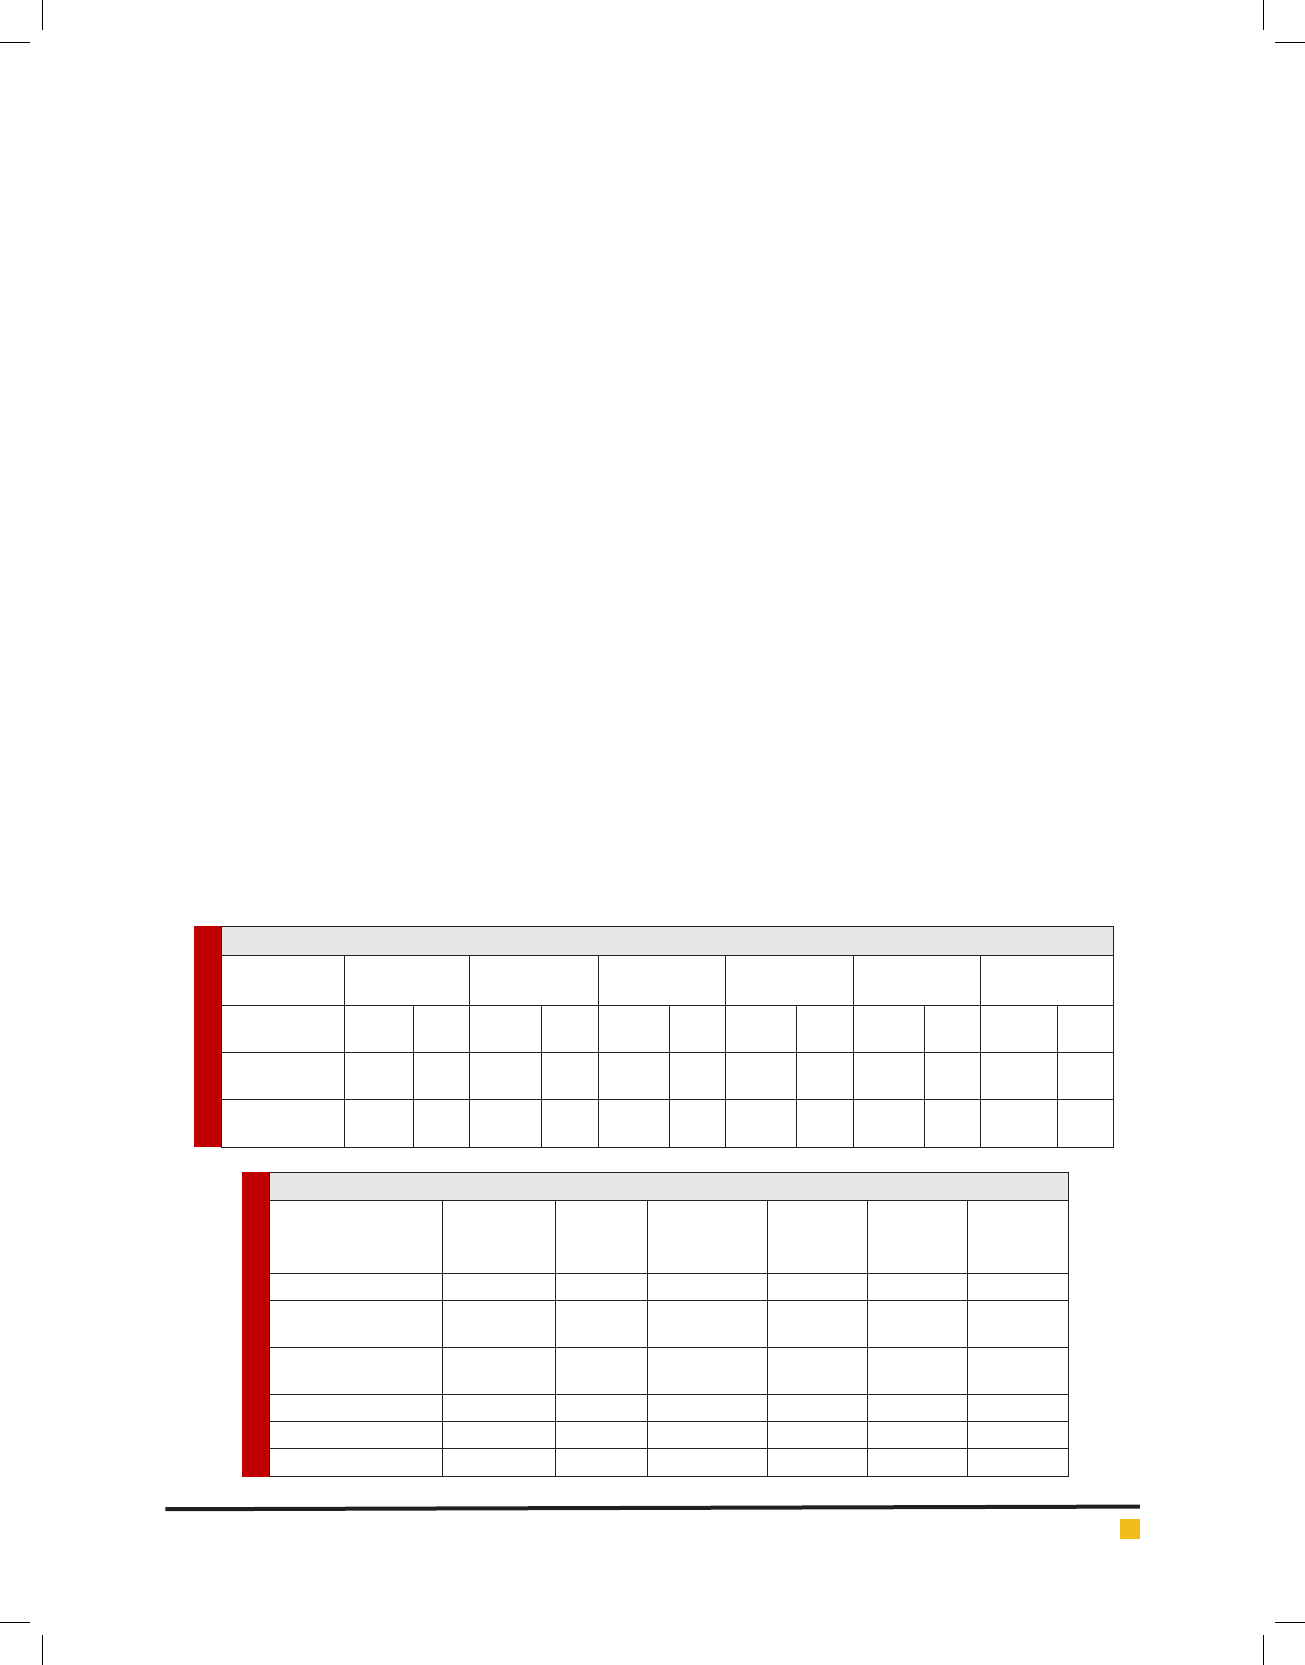
Table 7. Gland dry matter percentage of potato cultivars at different irrigation levels
AgriaMarfonaSpiritLucaHermes
Clone
397008-9
Irrigation
treatments
abc19.76bcd18.65bcd16.82bcd16.67bcd16.25bcd19Normal
irrigation
ab21.42ab20.59a21.75bcd17.34bcd19.02bcd18.85Moderate water
stress
a22.88bcd19.19bcd19.54bcd17.32bcd19.57bcd19.86Severe water
stress
Table 8. Correlation coef cient between traits in normal irrigation conditions
Gland
total
function
Gland dry
matter
percentage
Gland dry
matter
function
Protein
percentage
Protein
function
Methionine
level
-Gland function
0.79*-
Gland dry matter
percentage
0.97**0.90**-
Gland dry matter
function
0.96**0.91**0.96**-Protein percentage
0.94**0.80*0.94**0.96**-Protein function
0.78*0.99**0.90**0.920.81*-Methionine
Ziachehreh et al.
510 EFFECT OF WATER STRESS ON GLAND FUNCTION BIOSCIENCE BIOTECHNOLOGY RESEARCH COMMUNICATIONS
Table 9. Correlation coef cients between traits under moderate water stress
Gland
function
Gland dry matter
percentage
Gland dry
matter function
Protein
percentage
Protein
function
Methionine
level
-Gland function
0.34-
Gland dry matter
percentage
0.87*0.76-
Gland dry matter
function
0.190.510.38-Protein percentage
0.95**0.370.84*0.34-Protein function
0.370.99**0.780.490.41-Methionine level
Table 10. Correlation coef cients between traits under severe water stress
Gland
function
Gland dry matter
percentage
Gland dry matter
function
Protein
percentage
Protein
function
Methionine
level
-Gland function
0.26-
Gland dry matter
percentage
0.80-
Gland dry matter
function
0.260.99**0.75-Protein percentage
0.98**0.320.95**0.61-Protein function
0.550.83*0.550.80*0.31-Methionine level
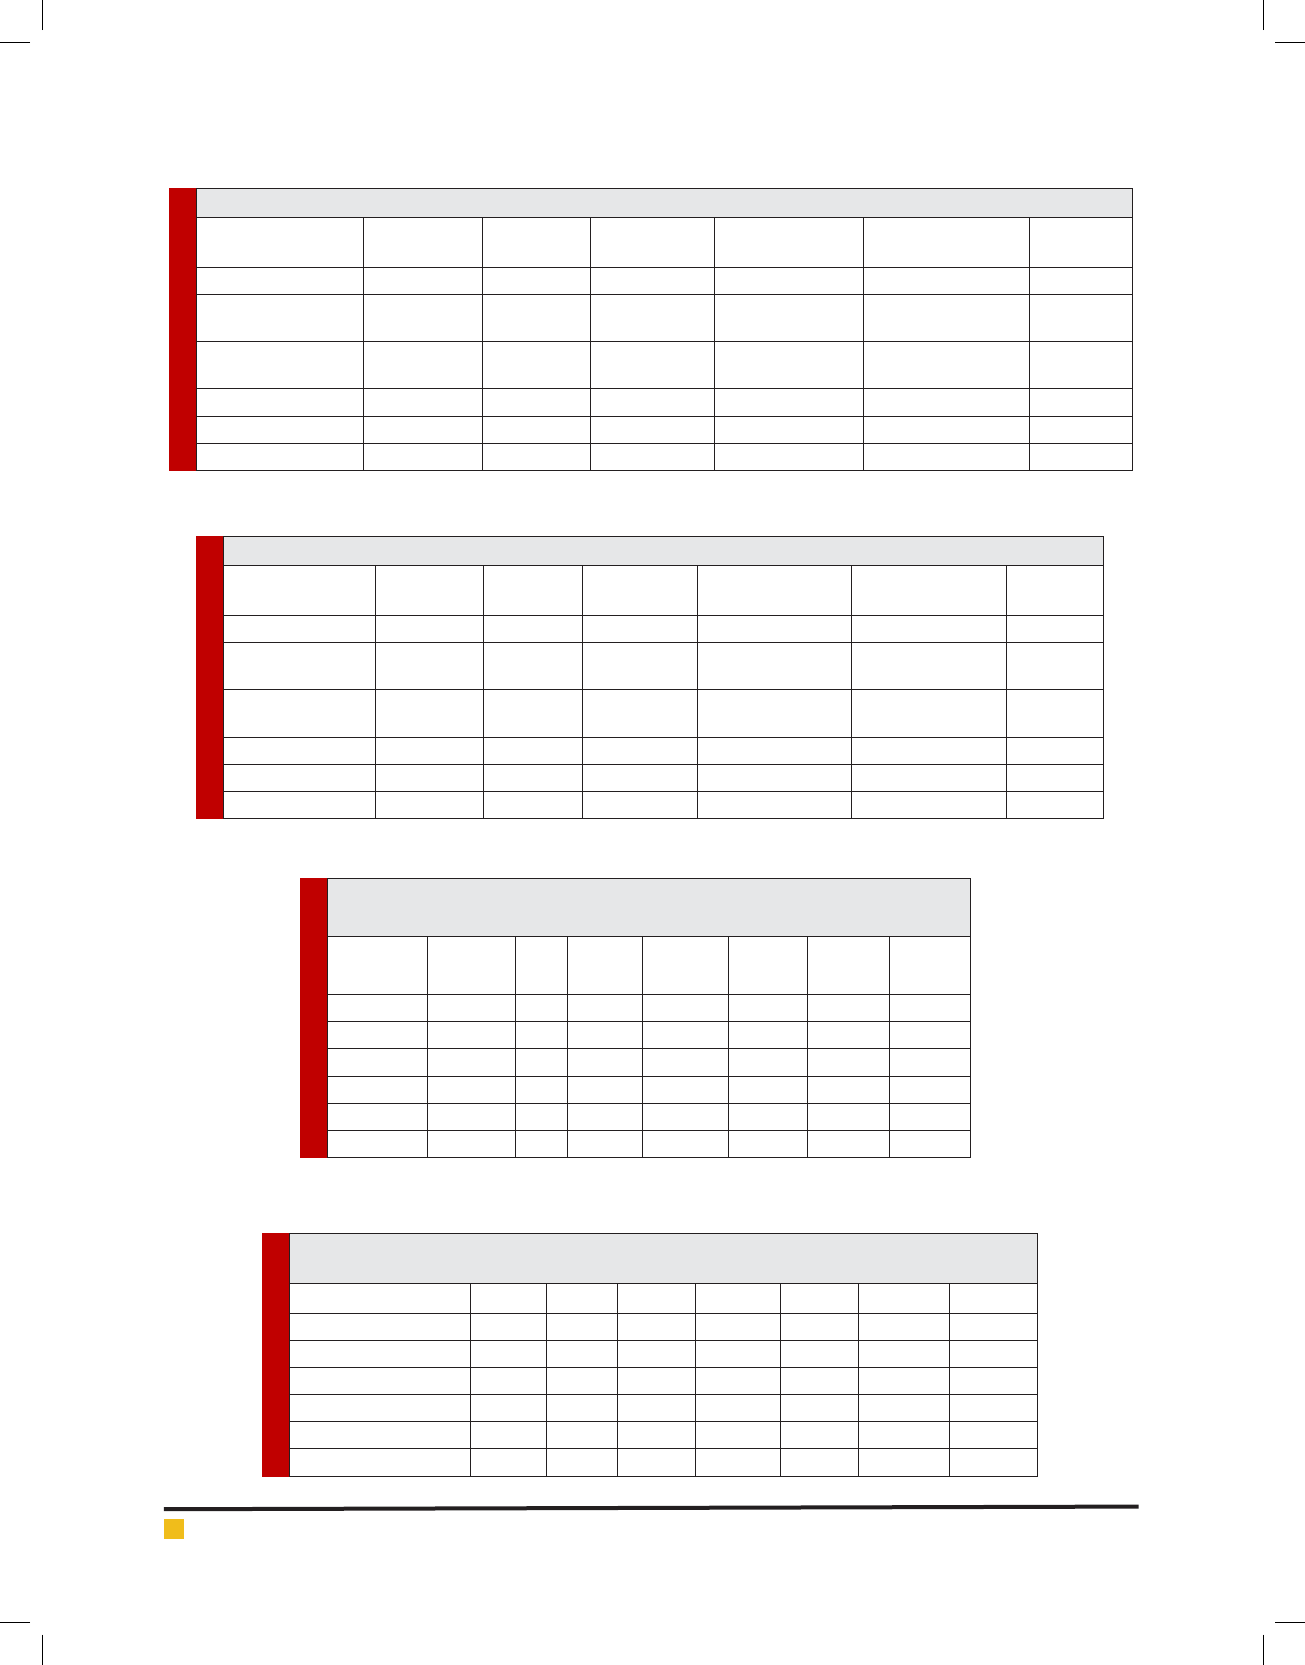
Table 11. Estimating tolerance and susceptibility of cultivars and clone to water
stress by indexes in moderate water stress
YPYSTOLGMPSTISSIMP
Cultivars
and clone
368902681011650305200.6842.1631070Agria
38220281507380343300.8072.1534530Marfona
35140306301610343200.9540.5134330Spirit
22860239301280222100.9440.6222220Luca
17440230805017340-17.280.0934620Hermes
3700033000767021670-14.000.0935670397008-9
Table 12. Estimating tolerance and susceptibility of cultivars and clone to water stress by
indexes in severe water stress
YPYSTOLGMPSTISSIMPCultivars and clone
368902524010090314500.7272.2931850Agria
382203084010070328000.7366.7233800Marfona
35140335304500328100.8723.2732890Spirit
22860215801070-233901.047-1.1923400Luca
17440173905630-200601.323-8.2320260Hermes
37000293304000349400.8922.7635000397008-9
Ziachehreh et al.
BIOSCIENCE BIOTECHNOLOGY RESEARCH COMMUNICATIONS EFFECT OF WATER STRESS ON GLAND FUNCTION 511
Table 13. Correlation coef cients between susceptibility indexes and tolerance to
drought and function in moderate water stress
YP YS TOL GMP STI SSI MP
YP 1
YS 0.893 1
TOL -0.051 -0.496 1
GMP 0.964 0.980 -0.315 1
STI 0.952 0.988 -0.353 0.999* 1
SSI 0.319 -0.712 0.963 -0.559* -0.593 1
MP 0.969 0.977 -0.297 1* 0.998* -0.544 1
Table 14. Correlation coef cient between susceptibility indexes and tolerance to drought and
function in severe water stress
YP YS TOL GMP STI SSI MP
YP 1
YS 0.937 1
TOL -0.528 0.792 1
GMP 0.973 0.992 -0.710 1
STI 0.960 0.997* -0.745 0.999* 1
SSI 0.289 -0.972 0.912 -0.936** -0.953* 1
MP 0.978 0.989 0.695 1** 0.997* -0.928 1
els and cultivars at the probability level of 1% (Table
4). Comparing the effect of irrigation levels on gland
dry matter percentage showed that the highest mean of
gland dry matter is related to moderate and severe water
stress conditions and these treatments were at the high-
est level of statistical group and showed a signi cant
difference with normal irrigation treatment (Table 5).
It seems that increased dry matter percentage of potato
under water stress is resulted from low level of gland
function. According to considering water stress treat-
ments in the same group and necessity for savings on
water consumption, moderate water stress is recom-
mended for nutritional goals and potato processing
(chips, franchise, etc.). Signi cant difference between
genotypes showed the existence of genetic variation
between cultivars. Comparing the effect of this cultivar
on this trait showed that Agria and Spirit have the high-
est mean of gland dry matter and showed a signi cant
difference compared with other cultivars. Hermes with
the lowest mean of gland dry matter was at the lowest
position of the statistical group (Table 6).
Comparing the mean of interaction between irrigation
levels and cultivar for this trait showed that Agria and
Spirit have the highest percentage of gland dry matter
under severe (22.8%) and moderate (21.75%) water stress
conditions and it seems that it can be used as a suitable
mixture to produce fried products and use in process-
ing industry to save water consumption in agriculture.
Correlation coef cient table showed that gland dry mat-
ter percentage has a signi cant and positive correlation
with most of traits (Table 8). Also, this trait under mod-
erate water stress showed a signi cant and positive cor-
relation with methionine level and under severe stress
condition, showed a signi cant and positive correlation
with methionine and gland protein percentage (Tables 9
and 10).
GLAND DRY MATTER FUNCTION
The results of analysis of variance for this trait showed
that there is a signi cant difference between cultivars
at the probability level of 1% while irrigation levels
and interaction between these factors did not show any
signi cant difference (Table 4). Signi cant difference
between genotypes shows the variety of genetic sub-
stance of cultivars for the trait. Comparing the effect
of cultivar on this trait showed that Marfona wit Luca,
clone 397008-9, and Agria have the highest gland dry
function mean and showed a signi cant difference with
other cultivars. In this study, Spirit and Hermes showed
the lowest mean of gland dry matter function at the sur-
face level (Table 6). Correlation coef cient table between
traits in normal irrigation condition showed that gland
dry matter percentage has a signi cant and positive
correlation with most of traits (Table 8). Also, this trait
under moderate water stress showed a signi cant and

Ziachehreh et al.
512 EFFECT OF WATER STRESS ON GLAND FUNCTION BIOSCIENCE BIOTECHNOLOGY RESEARCH COMMUNICATIONS
positive correlation with gland and protein function
(Tables 9 and 10). The results of studies by Kumar et al.
(2007) with different irrigation treatments showed that
increased water stress decreases gland dry matter func-
tion.
GLAND METHIONINE LEVEL
Analysis of variance for the trait of interest showed that
there is not any signi cant difference between different
irrigation levels and interaction between irrigation and
cultivar levels while cultivars for this trait showed a sig-
ni cant difference at the probability level of 1% (Table
4). Signi cant difference between genotypes showed the
variety of genetic substances for the trait of interest.
Comparing the mean of the effect of cultivar on this
trait showed that the highest methionine level belongs
to Agria , Marfona , and clone 3977008-9 and showed a
signi cant difference with other cultivars. Luca, Hermes,
and Spirit produced lowest level of gland methionine
(Table 6). Correlation coef cient table between traits in
normal irrigation condition showed that gland methio-
nine has a signi cant and positive correlation with
most of traits (Table 8). Also, this trait, under moderate
water stress, showed a signi cant and positive correla-
tion with gland dry matter percentage and under severe
water stress, showed a signi cant and positive correla-
tion with gland dry matter percentage and gland protein
percentage (Tables 9 and 10). Muttucumaru et al. (2015)
by investigating 5 cultivars of potato resistant and sus-
ceptible to drought found out that cultivars were signi -
cantly different in terms of methionine concentration.
Also, methionine concentration of cultivars resistant to
drought is higher than cases sensitive to drought.
CONCLUSION
Moderate water stress lead to the production of suitable
gland function. Also, the highest percentage of gland pro-
tein (3.76%), gland protein function, and highest dry mat-
ter percentage (19.83) belonged to this treatment. There-
fore, due to the economic importance of gland function
and decreased levels of water consumption (2910 cubic
meter) compared with normal treatment, the implemen-
tation of moderate stress and replacing it with normal
irrigation seems more economic. Agria and Marfona
produced the highest protein percentage (4%) and gland
methionine. Also, Agria and Spirit in severe (22.88%) and
moderate (21.75%) water stress conditions showed high-
est gland dry matter percentage and it seems that it can
be introduced as a suitable treatment. The highest values
of gland protein function belonged to Agria and Mar-
fona . Clone 397008-9 produced the highest gland func-
tion mean ((33100 kg/ha) and according to MP indexes
(severe and moderate water stress), SSI (moderate water
stress), and GMP (severe water stress) showed higher tol-
erance compared with water stress and it can be used for
commercial purposes. High correlation between STI and
genotype functions in stress and stress-free environments
showed the superiority of this index in screening tolerant
genotypes and function tolerance estimation.
REFERENCES
Ahmadi, R. (1996). Determining water consumption of potato.
Final report of
agricultural research and education station and
natural resources of Ardabil.
Unknown. (2016). Meteorological statistics and information of
Ardabil.
Hasanpanah, D., Hoseinzadeh, A. (2007). Methodology and
assessment of sources resistant against drought in potato cul-
tivars.
Final report of agricultural research and education sta-
tion and natural resources of Ardabil.
Haghighi, B., Boroomand, S., Naseri, A. (2015). The effect of
irrigation on the function of some qualitative and quantitative
characteristics of potato cultivars. Journal of plant physiologi-
cal studies, Islamic Azad University of Ahwaz, 7 (28): 45-60.
Kazemi, H. (1994). Diligence principles, Tabriz University Pub-
lications.
Bradford, M.M. 1976. A rapid and sensitive method for the
quantitation of microgram quantities of protein utilizing the
principle of protein-dye binding. Anal Biochem. 72: 248-254.
FAO. 2014. FAOSTAT database for agriculture. Available online
at: http://faostat3.fao.org/faostat-gateway/go/to/download/Q/
QC/E.
Fischer, R.A., and Mourer, R. 1978. Drought resistance in spring
wheat cultivar. I: Grain yield responses. Australian Journal of
Agricultural Research. 29: 897-912.
Hassanpanah, D. 2010a. Evaluation of potato advanced cul-
tivars against water de cit stress under in vitro and in vivo
condition. Biotechnology. 92: 164-169.
Hassanpanah, D. 2010b. Effects of water de cit and potassium
humate on tuber yield and yield components of potato culti-
vars in Ardabil region, Iran. Research Journal of Environment
Science. 3: 351-356.
Kumar, R., Kang, G.S., and Pandey, S.K. 2007. Inheritance of
resistance to late blight (Phytophthora infestans) in potato.
Euphytica 155:183–191.
Li, W., Xiong, B., Wang, S., Deng, X., Yin, L., and Li, H. 2016.
Regulation Effects of Water and Nitrogen on the Source-Sink
Relationship in Potato during the Tuber Bulking Stage. PLoS
ONE journal. 11: 1-18.
Moradi Dalini, A., Nishabori, M., Jahanbakhsh Asl, S., and
Jafarzade, A. 2000. Determination and Evaluation of Pan Coef-
cient Class a in Different Condition, Journal of soil & Water
Sci., 14 (2), pp. 164-175.
Muttucumaru, N., Powers, S.J., Elmore, J.S., Mottram, D.S.,
and Halford, N.G. 2015. Effects of Water Availability on Free

Ziachehreh et al.
BIOSCIENCE BIOTECHNOLOGY RESEARCH COMMUNICATIONS EFFECT OF WATER STRESS ON GLAND FUNCTION 513
Amino Acids, Sugars, and Acrylamide-Forming Potential in
Potato. Journal of Agricultural and Food Chemistry. 63: 2566-
2575.
Ommen, O.E. 1999. Chlorophyll content of spring wheat ag
leaves grown under elevated CO2 concentration and other
environment stress within the ESPACE-wheat project. Euro-
pean Journal of Agronomy. 10: 197-203.
Passioura, J.B. 2007. The drought environment: physical, bio-
logical and agricultural perspectives. Journal of Experimental
Botany. 58: 113-117.
Rezazadeh, A., Naja Mood, M.H., Ramezani, Y., and Naghavi,
H. 2015. In uence of irrigation method, drought stress, and
fertilizer type on yield and yield components of potato . Applied
Science Reports. 2: 134-142.
Rosielle, A.A., and Hamblin, J. 1981. Theoretical aspects of
selection for yield in stress and nonstress environments. Crop
Science. 21: 943-946.
Shock, C.C., Shock, B.M., and Welch, T. 2013. Strategies for
Ef cient Irrigation Water Use. Sustainable Agriculture Tech-
niques, Oregon State University.