
Agricultural
Communication
Biosci. Biotech. Res. Comm. 10(2): 276-286 (2017)
Evaluation of drought stress tolerance in advanced
barley cultivars in Sistan region
Fatemeh Sefatgol and Hamidreza Ganjali*
Department of Agriculture, Islamic Azad University, Zahedan Branch, Zahedan, Iran
ABSTRACT
A separate experiment was conducted in a randomized complete block design with four replications in Agricultural
Research Center of Sistan in 2014-15 crop year to investigate the effects of drought stress at the end of season on
yield, yield components and stress assessment indicators in 10 barley lines.To apply drought stress, after 50% emer-
gence of cluster, irrigation was cut until the harvest. But irrigation was done in normal conditions until the end of
the growing season and traits such as kernel yield, kernel per cluster, Thousand Kernel Weight (TKW), cluster length
and plant height were measured. Barley lines had different reactions to the two conditions. Drought stress reduced
yield and yield components. MP, GMP, HARM, SSI, TOL and STI indices were also evaluated. Results showed that
the Lign and Brs180 lines were most resistant to the optimum and stress conditions and Lign line performed well in
optimal conditions. MP, GMP, HARM and SSI indices showed a high correlation with kernel yield under irrigation
and stress conditions. They were the most suitable indices in both conditions given the correlation between drought
resistance indices.
KEY WORDS: DROUGHT STRESS, STRESS INDICES, BARELY YIELD
276
ARTICLE INFORMATION:
*Corresponding Author:
Received 31
th
March, 2017
Accepted after revision 29
th
June, 2017
BBRC Print ISSN: 0974-6455
Online ISSN: 2321-4007 CODEN: USA BBRCBA
Thomson Reuters ISI ESC and Crossref Indexed Journal
NAAS Journal Score 2017: 4.31 Cosmos IF : 4.006
© A Society of Science and Nature Publication, 2017. All rights
reserved.
Online Contents Available at: http//www.bbrc.in/
INTRODUCTION
Generally, stress is de ned as any change in environ-
mental conditions which leads to loss or adverse changes
in an action or in other words, refers to any change in
environmental conditions that makes plant’s reaction
out of appropriate or optimal condition. Environmental
stresses are divided into two categories: biological stress
and physicochemical stress. Biological stress caused
by pests attack and diseases in plants and competing
with other organisms that is mostly related to pathology
and ecology. Physicochemical stresses are divided into
ve main categories: drought, temperature, radiation,
chemical and mechanical tensions, of which the drought

Fatemeh Sefatgol and Hamidreza Ganjali
tension, salinity and temperature tensions are wide-
spread in the world and hence have been studied more
(Lovitee, 2000 Ata Sheikh 2005; Javadi et al, 2017).
Drought stress does not have the same effect on all
aspects of plant growth thus some processes are very sen-
sitive to increased drought stress that means the response
of plants to drought stress is different and depends on
plant growth stage where drought occurs (Brad ford
2004). Drought stress has a major impact on plant phe-
nological and morphological traits. Drought stress delays
the formation of yield components and performance is
decreased by reducing the number of grains and grain
weight (Inuy ama, 2000). Water shortages in the pol-
lination stage cause reduction of seed numbers in most
grains yield loss occurs during pregnancy or pollina-
tion. Barley is most susceptible to drought stress during
stem elongation, pregnancy and spike emergence and if
drought stress occurs in this stage yield loss will be the
highest. This suggests that the timing of owering and
pollination is the most sensitive developmental period of
barely to drought (Bidinger et al, 2000).
In this study, the growth of the ve barley cultivars
to drought stress were monitored, drought stress before
pollination delayed phonological growth while drought
after pollination stage (maturity date) accelerated pho-
nological growth. Also drought stress duration had
different effects on each growing stages. Early season
stress, delayed pollination time and physiologic matu-
rity whereas stress during owering and nal stage (in
the aggregation) shortened grain lling period to 10 to
11 days (Simane et al, 2003; Fard et al., 2017).
In a study on several varieties of barley studying
the relationship between yield and number of mor-
phological, phenological and physiological property
is expressed under nal drought stress that genotypes
having a longer growth period and shorter grain lling
are suitable for cultivation in arid areas (Ortiz-Ferrara
et al, 2001). The aim of this study was to investigate the
effects of drought in the end of season on yield, yield
components and stress assessment indicators in 10 bar-
ley lines, separate experiments are conducted in Sistan
Agricultural Research Center in the 2014-2015 crop year.
MATERIAL AND METHODS
Type of plants used consists of advanced barley geno-
types provided from Karaj Seed and Plant Improvement
Research Institute.
Speci cations of testing plan: to evaluate enhanced
drought tolerance in barley cultivars in Sistan region,
this experiment is done in a basic design of randomized
complete block with four replications. Test treatments
included 10 varieties of barley (b1, b2, b3, b4, b5, b6,
b7, b8, b9, b10) which in normal moisture conditions
and drought stress conditions were analyzed separately.
Experimental design map is shown in Table 2.
RESULTS AND DISCUSSION
3-1. The effect of measured traits of barley cultivars in
normal conditions
The results of the variance analysis data show signi -
cant differences between cultivars in plant height in nor-
mal conditions at ve percent statistical level (Table 1).
3-2. The effect of measured barley traits under
drought stress
Plant height is one of the traits that is affected by
agronomic factors, and changes treatments. The results
of the data variance analysis show that there is sig-
ni cant difference between cultivars in plant height in
drought stress conditions in a ve percent statistical
level (Table 2).
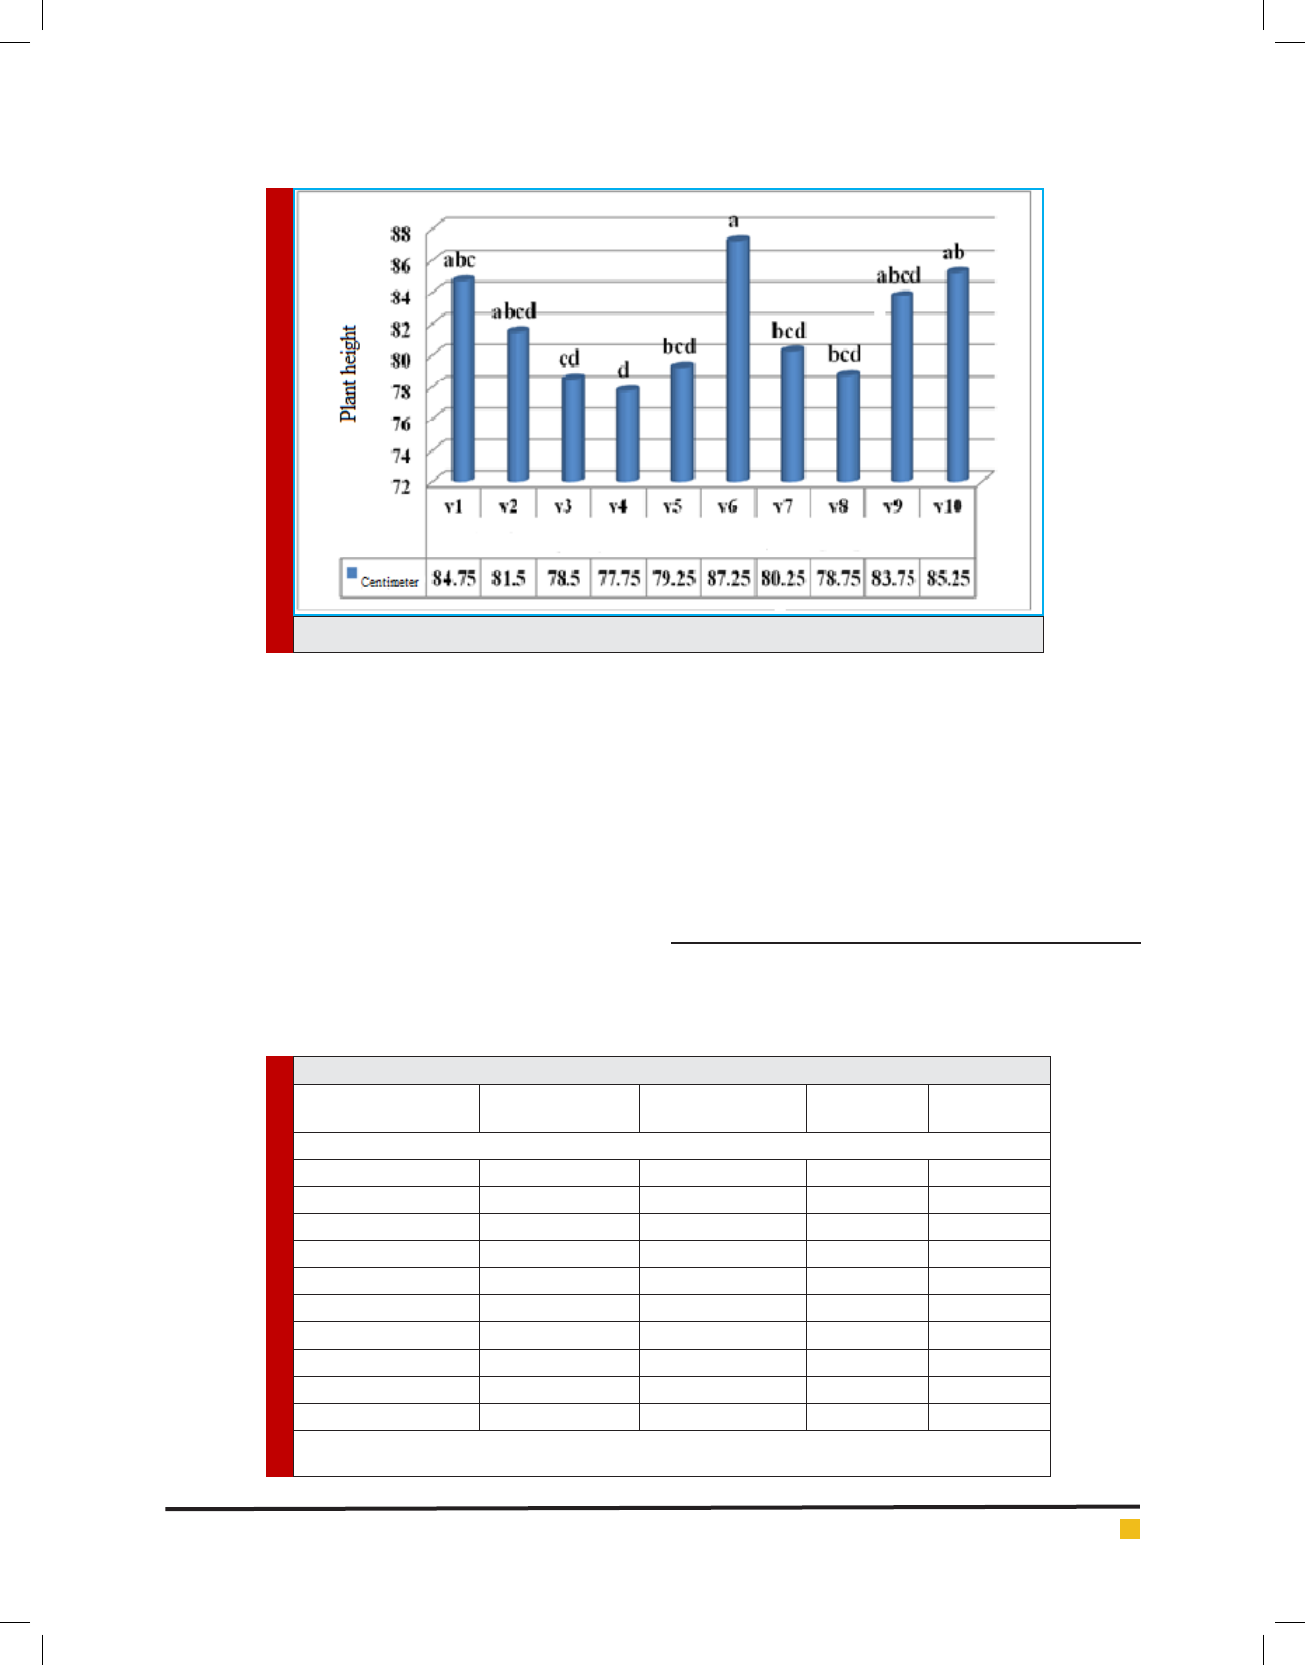
Highest bush height is for Violeta with an average
height of 25.87 cm the and the lowest is for Merzaga
with an average height of 25.79 cm (Figure 1).
Plant height: Plant height decreased with increasing
drought stress can be impaired to de cit photosynthesis
Table 1. Name and properties for genotypes
Entry No Pedigree
1 Cheek Zahak
2 3 Lignee 527/ NK1272/ jLB70-63/3/L. 527//Chn-01/ Gostoe/4/Rhn-08/3/Deir Alla 106/D17/Karoon
3 6 Comp- 1-71-E/1- BC-80320
4 8 Trompillo/ Beecher
5 9 Merzaga (Orge0077) Alanda-01
6 10 VIOLETA/MJA// (LIGEE640/P1382758/DC- B/3/MOLA/4/LINO)
7 11 Kavir/Badia/ 1-BC-80073
8 12 L.1242/Hesk/5/Mola/Shyri/Arupo*2/JET/3/Aleli/4/Mola/…
9 13 SHENMAI NO.3/MSEL/CANELA
10 14 BRS180/M98.77/6/P. STO/3/LBIRAN/UNA80/ LIGNEE640/4/BLLU/5/ PETUNIA1
BIOSCIENCE BIOTECHNOLOGY RESEARCH COMMUNICATIONS EVALUATION OF DROUGHT STRESS TOLERANCE IN ADVANCED BARLEY CULTIVARS IN SISTAN REGION 277
Fatemeh Sefatgol and Hamidreza Ganjali
Table 2. Experimental design map
R2 b1 b2 b3 b4 b5 b6 b7 b8 b9 b10
R1 b10 b8b6b4b2b1b5 b9b3 b7
R4 b8 b6 b2 b5 b3 b1 b10 b7 b9 b4
R3 b6 b5 b1 b7 b4 b8 b2 b3 b10 b9
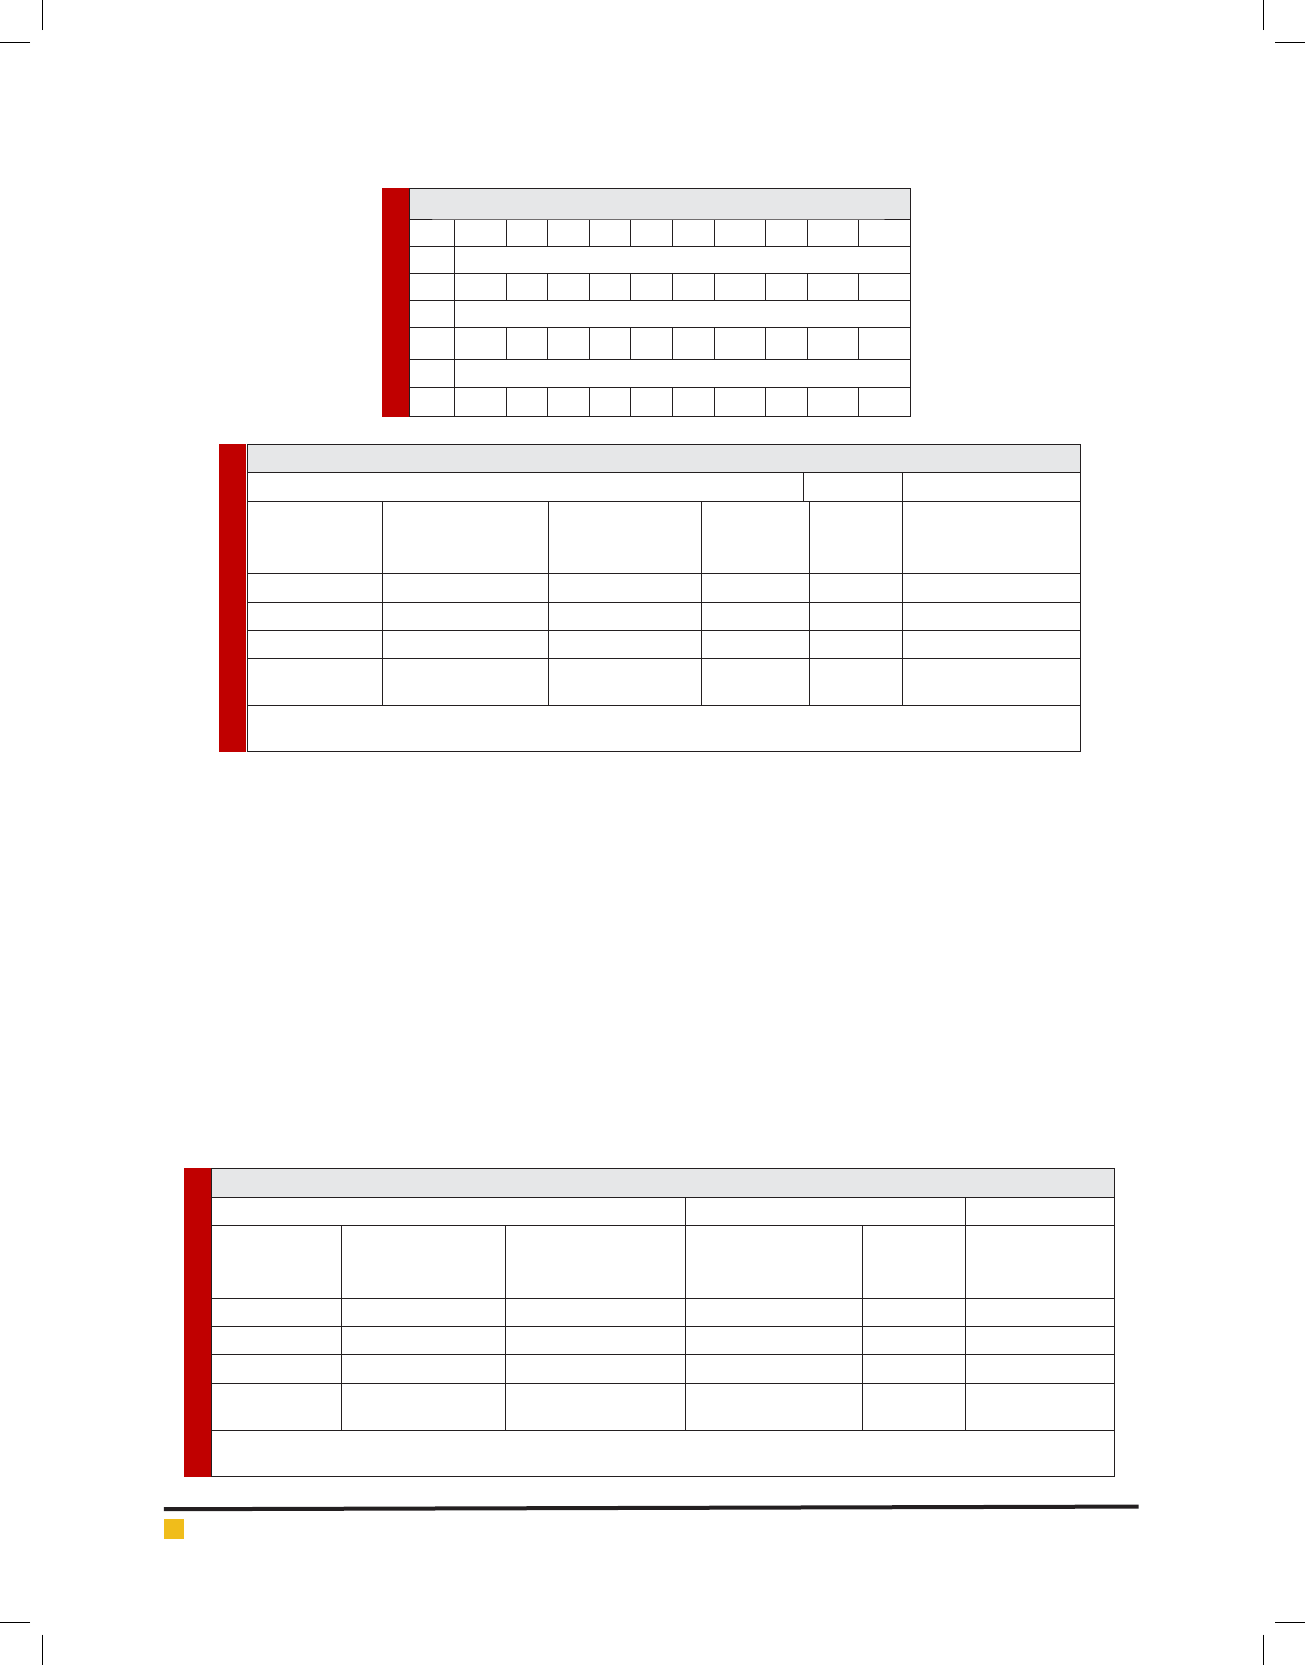
Table 1. Variance analysis of measured traits in normal conditions
average of squares
Source of changesDegree of
freedom
Plant
height (cm)
Biological yield
(tons per hectare)
grain yield
(tons per hectare)
Harvest index
(Percent)
Block3238.90.0300.84180.06
Types988.82*0.089*0.316*25.04*
Error2732.130.0320.1368.54
coef cient of variation
(%) C.v
-6.295.5711.057.85
ns: Meaningless
*and**: Means signi cant at probability level of ve percent
due to low soil moisture and reduction in photosynthetic
in plant to genetic potential for height, among others.
Positive effect of irrigation on increasing plant growth
and phenological stages in accordance with the environ-
mental conditions and optimal use of resources in this
process is also inferred.
In another experiment the effect of drought stress in
plant height reduction is reported by Jafarzadeh (2004)
that corresponded with the results of this study. One of
the effects of water scarcity, reduction of in ammation-
mediated cell-cell defect in that it would reduce stem
elongation and leaf photosynthesis in plants. Thus
drought stress reduce stem height (Dixon et al., 2004),
changes in plant height is usually the most obvious
change is the result of growth in most crop plants. Plant
Height is also affected by environmental humidity and
the main sign of water stress in vegetative stage reduc-
tion in the number and size of leaves. If the water short-
age continues plant loss lower leaves and plant height
will be signi cantly lower than normal (Flenet, 2003).
Biological yield: Based on the results of the variance
analysis data no signi cant differences between culti-
vars for biological yield in drought stress conditions is
seen (Table 2).
As concluded from the table of mean comparisons
Violeta has highest biological yield with the average
78/2 tons per hectare and lowest average biological
yield of 61.2 tons per hectare was achieved from Mer-
zaga. It seems that due to favorable weather conditions
the irrigation for the violeta has a positive effect on the
Table 2. Variance analysis of traits measured in drought
average of squares
Changes sourceDegree of
freedom
Plant height (cm)Biological yield
(tons per hectare)
grain yield
(tons per hectare)
Harvest index
(Percent)
Block337.460.8332.71159.30
Types944.26*0.076ns0.35ns27.26ns
Error2715.610.1180.2930.54
coef cient of
variation (%)C.v
-4.8313.1925.1319.02
ns: Meaningless
*and**: Means signi cant at probability level of ve percent
278 EVALUATION OF DROUGHT STRESS TOLERANCE IN ADVANCED BARLEY CULTIVARS IN SISTAN REGION BIOSCIENCE BIOTECHNOLOGY RESEARCH COMMUNICATIONS
Fatemeh Sefatgol and Hamidreza Ganjali
BIOSCIENCE BIOTECHNOLOGY RESEARCH COMMUNICATIONS EVALUATION OF DROUGHT STRESS TOLERANCE IN ADVANCED BARLEY CULTIVARS IN SISTAN REGION 279
growth and caused the maximum length and height.
The increase in height and growth cause increased leaf
area and thereby cause an increase in photosynthesis
and higher dry matter production and yield will result.
Accordingly, most biomass is also observed in this treat-
ment. Probably tensions through reduced plant height,
which is result of high sensitivity the process of divi-
sion and cell growth to drought stress cause decrease in
rate of non-structural carbohydrates stored in the stems,
reduced leaf area and photosynthesis is reduced and as a
result, plant fresh weight is decreased.
The test results also complies with Barut Zadeh etal.
(2008). If lack of water caused by drought and lack of
rainfall in the growing season continues, plant encoun-
ters with lower growth in vegetative and reproductive
growth stages. During the period of reproduction, stems
are active tank for dry matter and perhaps other nutri-
ents (Edalatian, 2008). Frbvdnya (2004) reported that
drought stress in vegetative and reproductive growth
stages reduced biological yield.
GRAIN YIELD
Grain yield is function of the three parameters: clus-
ters per square meter, number of grains per spike and
FIGURE 1. Comparison of the average height of plant varieties under drought stress
Table 3. Comparison of the mean measured traits under drought stress
Experimental
treatments
Plant height
(cm)
Biological yield (tons
per hectare)
Grain yield (tons per
hectare)
Harvest index (percent)
Types
Type 184.75abc2.71a2.50ab29.50a
Type 281.50abcd2.64a2.13ab28.75a
Type 378.50cd2.45a1.93ab27a
Type 477.75d2.34a1.76b25.75a
Type 579.25bcd2.61a2.03ab27.75a
Type 687.25a2.78a2.38ab33.75a
Type 780.25bcd2.63a2.06ab28.50a
Type 878.75bcd2.51a1.98ab27a
Type 983.75abcd2.69a2.16ab29.25a
Type 1085.25ab2.73a2.76a33.25a
Posts that have common letters in each column, according to Duncan’s multiple range test do not have signi cant difference
in ve percent probability level
Fatemeh Sefatgol and Hamidreza Ganjali
280 EVALUATION OF DROUGHT STRESS TOLERANCE IN ADVANCED BARLEY CULTIVARS IN SISTAN REGION BIOSCIENCE BIOTECHNOLOGY RESEARCH COMMUNICATIONS
Table 4. Variance analysis of measured traits in drought condition
Source of changesSource of
changes
Source of
changes
Source of
changes
Source of
changes
Source of
changes
Block3171090.4304.7134.240.84
Types912168.5ns117.3*131.2*11.08ns
Error2711256.438.3452.9911.46
coef cient of variation
(%) C.v
-19.8513.2411.727.98
ns: Meaningless
*and**: Means signi cant at probability level of ve percent
thousand kernel weight. Multiple factors such as mois-
ture levels can be effective in improving the quality and
quantity of grain (Arshi, 2004). Based on the results of
data analysis no signi cant differences between culti-
vars for grain yield in drought stress conditions is seen
(Table 3). As can be deduced by comparisons of mean
grain yield of violeta with an average of 2/38 tons per
hectare and the lowest yield was obtained from the Mer-
zaga with an average of 2/03 tons per hectare, which
can be caused by growth reduction and yield compo-
nents for these types.
Harvest index: harvest index shows ef ciency in
distribution of photosynthetic products in to grain in
plants. Based on the results of the variance analysis no
signi cant differences among varieties for harvest index
under drought stress conditions is seen (Table 2). As
concluded from table of comparisons of mean harvest
index, highest harvest index was obtained from vio-
leta with the average of 75/33% and the lowest harvest
index was obtained from the Merzaga with an average
of 75/27 % (Table 3). In other words, additional plant
dry matter does not produce, but a large part of the grain
dry matter allocated to economic performance.
A plant performance can be increased by increasing
the share of total dry matter production on the farm
or raise economic performance (Koochaki and Srmdnya,
1993).
The number of clusters per square meter: based on the
results of data analysis no signi cant difference between
the gures for the number of clusters per square meter
in drought stress conditions is seen (Table 4). However,
based on what can be inferred from the table of mean
comparisons Violeta had largest number of clusters per
square meter and the average cluster was 2/606 due to
the proper humidity conditions. The lowest number of
clusters per square meter was an average of 2/486 clus-
ter numbers for Merzaga (Table 4). Goksoy etal. (Goksoy
et al., 2004) concluded that the stress test results face
signi cant reduction in the number of heads.
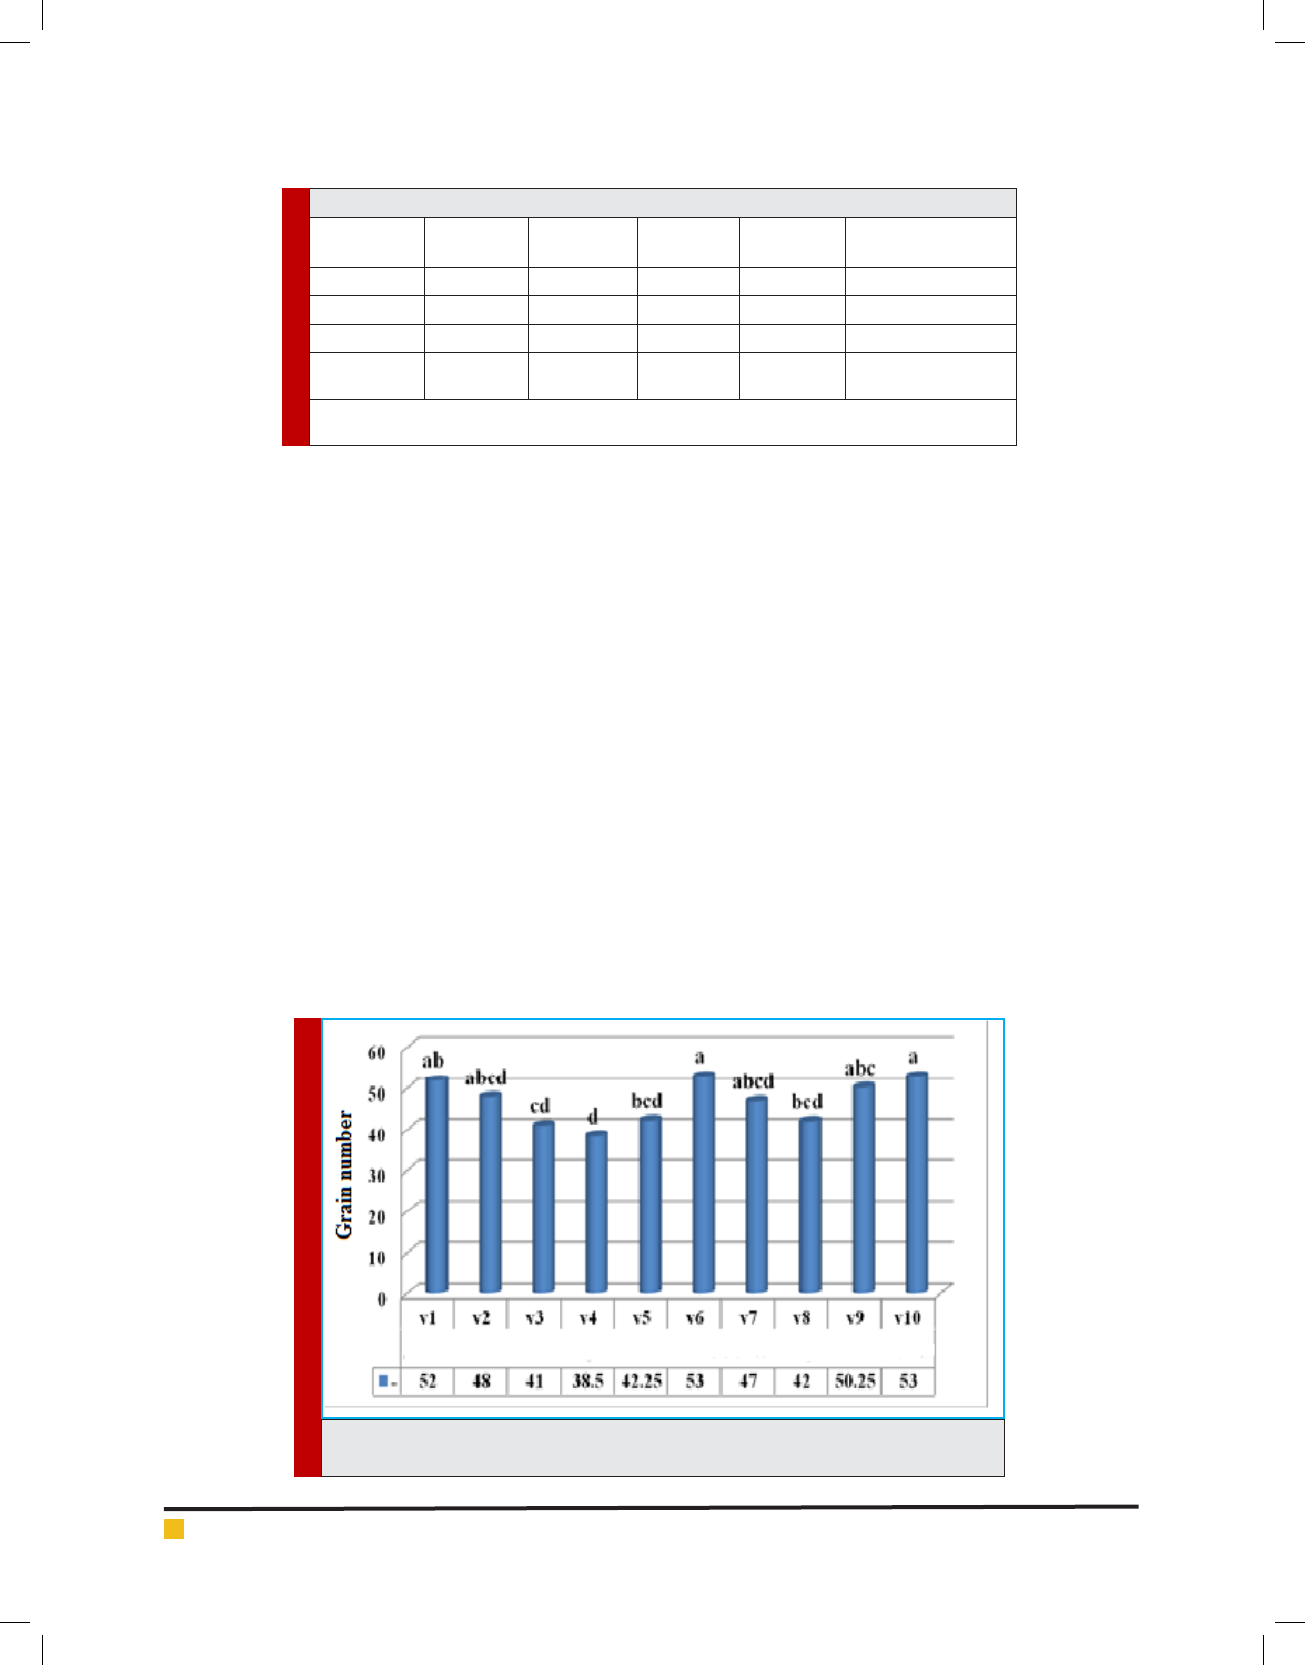
Grain number: the number of grains per panicle one
of the most important factors in increasing the perfor-
mance of the barely. Drought stress by reducing the leaf
FIGURE 2. Compare the average number of grains per panicle varieties under drought
stress
Fatemeh Sefatgol and Hamidreza Ganjali
BIOSCIENCE BIOTECHNOLOGY RESEARCH COMMUNICATIONS EVALUATION OF DROUGHT STRESS TOLERANCE IN ADVANCED BARLEY CULTIVARS IN SISTAN REGION 281
area cause photosynthetic source to reduce and loss
of enzyme activity in uencing this process (Koochaki,
2003). Results of variance analysis showed a signi cant
difference between the types in the number of grains
in drought stress conditions in a ve percent statistical
level (Table 4). As can be inferred from the table of mean
comparisons largest number of grains per panicle is for
the violeta , averaging 53 seeds and the lowest num-
ber of grains per panicle is for Merzaga with an aver-
age grain of 25/42, respectively (Figure 2).Studies have
shown that drought stress reduced the number of grains
per ear and weight of thousand grains. (Kazempour and
Tajbakhsh, 2002)
It seems stoping irrigation at owering stage is effec-
tive in reducing ower-producing cells and ultimately
affect their fertility, so that its effect in reducing the
number of seeds per head has been revealed. The number
of seeds per head is reduced with increasing water stress
signi cantly. The obtained results correspond with the
results of Gomez et al (Gomez et al., 2003) and Goksoy
et al. (Goksoy et al., 2004) that reported reduction in
number of seeds per head under water stress.
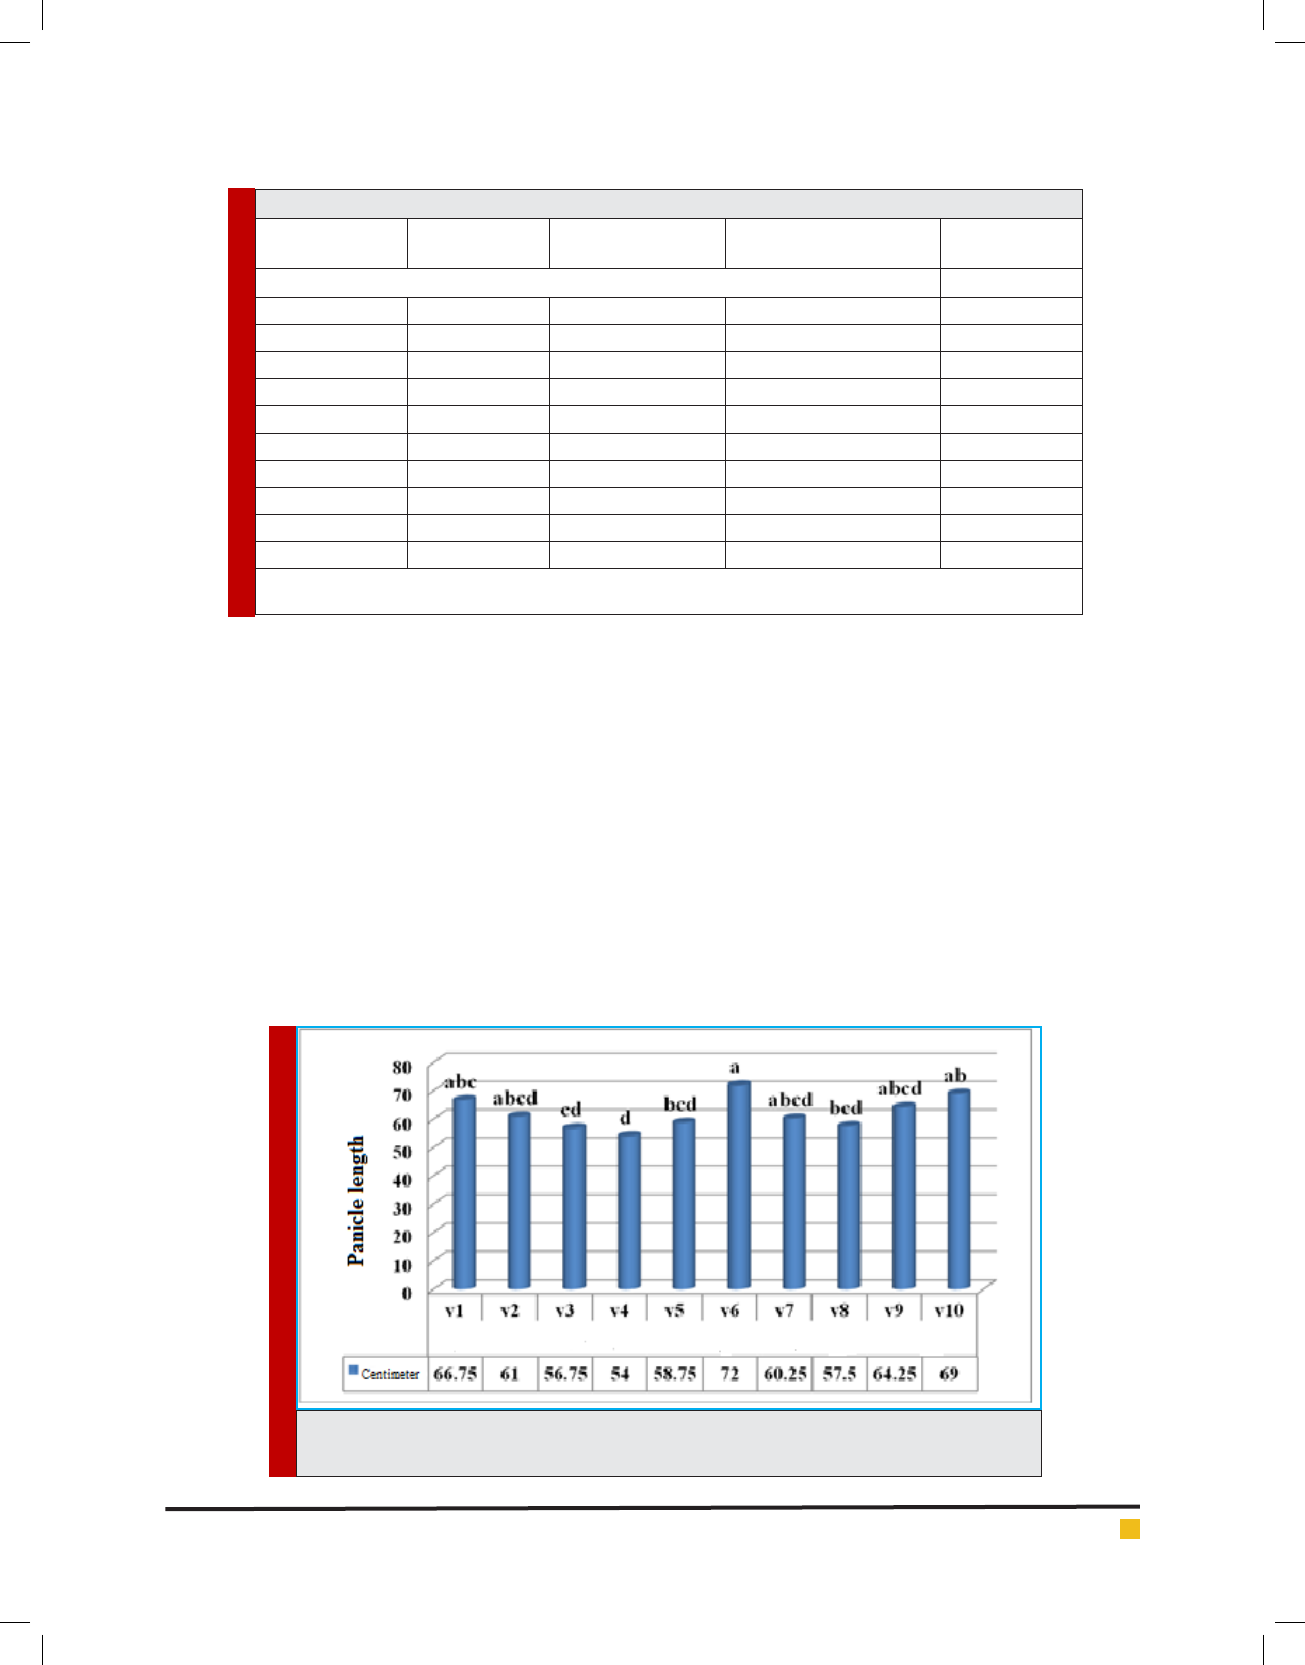
Panicle length: panicle length, is affected by grain
number in panicle thereby is effective in increasing the
yield. The results of variance analysis of data showed
signi cant differences among cultivars in the cluster
length under drought stress conditions in a statistical
level of ve percent (Table 4). As interpreted from table
of mean comparisons maximum panicle length of 72
cm was for violeta the minimum number of grains per
Table 5. Comparison of average measured traits under drought stress
Experimental
treatments
The number of clusters
per square meter
The number of
grains per panicle
Panicle length
(cm)
Thousand Seed
weight (g)
Types
Type 1585a52ab66.75abc43.37a
Type 2547a48abcd61abcd43.13a
Type 3468.2a41cd56.75cd40.35a
Type 4462.2a38.50d54d39.97a
Type 5486.2a42.25bcd58.75bcd41.48a
Type 6606.2a53a72a45.35a
Type 7539a47abcd60.25abcd42.23a
Type 8482.2a42bcd57.50bcd41.13a
Type 9576.7a50.25abc64.25abcd43.22a
Type 10589.7a53a69ab43.64a
Posts that have common letters in each column, according to Duncan’s multiple range test do not have signi cant difference in ve
percent probability level
FIGURE 3. Comparison of the average length of cluster under the in uence of cultivars under
drought stress
Fatemeh Sefatgol and Hamidreza Ganjali
282 EVALUATION OF DROUGHT STRESS TOLERANCE IN ADVANCED BARLEY CULTIVARS IN SISTAN REGION BIOSCIENCE BIOTECHNOLOGY RESEARCH COMMUNICATIONS
Table 6. Correlation of measured traits for barley cultivars under drought stress
TraitsPlant
height
Biological
yield
Grain
yield
Harvest
index
Spikes per
square
meter
Number of
grains per
panicle
Panicle
length
Thousand
Kernel
Weight
11
20.68**
30.221
40.020.63**1
50.180.42*0.97**1
60.31*0.180.43**0.36**1
70.140.260.51**0.59**0.551
80.190.220.39*0.28-0.41** 0.73**1
90.08-0.17-0.43*0.71**0.56** -0.28-0.191
ns: Meaningless
*and**: Means signi cant at probability level of ve percent
FIGURE 4. Comparison of average stress intensity on types
panicle was for Merzaga with an average of 75/58 cm,
respectively (Figure 3).
It seems water stress in vegetative growth stages,
reduce the leaf area index and absorption and trans-
port of nutrients and changes the yield components and
grain yield (Baroot Zadeh et al., 2010), The ndings of
Sakizade (2003), stated that under water stress grain
yield decreased is consistent with ndings of this study.
Outter et al (Outter et al., 2007), reported that drought
stress reduced grain yield in corn and this reduction cor-
related with a decrease in the number of seeds despite
to the weight of the grains. Drought stress was clearly
de ned by its impact on the reduction of biomass
growth, reduced yield components and ultimately grain
yield (Ardalan et al., 2012).
Paknezhad etal. (2006), in the same test reported
that drought had a signi cant effect on grain yield and
yield components and severe stress caused 37 percent
yield decrease. Ec (Eck, 2004), also in his studies con-
rmed that a 2-week and 4-week stress during vegeta-
tive growth, respectively, decreased performance by 23
percent and 46 percent. Chapman et al (Chapman et al.,
2007), reported a decrease of 17% and 80% reduction
in the average stress and severe tensions respectively.
Ahmadi et al. (2010), also in the same trial reported
that most of the traits showed a negative reaction to
stress that was the greatest effect on performance due
to the sharp decline in the number of grains per ear, ear
length and grain weight. T he weight of one thousand
seeds:
Fatemeh Sefatgol and Hamidreza Ganjali
BIOSCIENCE BIOTECHNOLOGY RESEARCH COMMUNICATIONS EVALUATION OF DROUGHT STRESS TOLERANCE IN ADVANCED BARLEY CULTIVARS IN SISTAN REGION 283
No signi cant differences among varieties for seed
weight under drought stress conditions (Table 4). How-
ever, based on what can be inferred from the table of
mean comparisons Violeta has highest average seed
weight with 35/45 grams and Merzaga with lowest seed
weight with an average of 48/41 grams were obtained
(Table 5). Because it can reduce the impact of water
scarcity and Smylaty material transport to grain. It
seems that the lack of photosynthetic material in case of
drought can cause thousand grain weight not to reach
its maximum potential limit. Grain weight is function
of its lling period and speed that is provided form two
sources of current photosynthesis and remobilization
of the plant food storage. Lack of soil moisture during
the growing season, especially in the reproductive stage
reduce current photosynthesis, rate and duration of
grain lling and the weight of it. However, environmen-
tal stress such as drought stress, increases remobilization
of supply from secondary sources (stems and petioles) to
the reservoir (seeds) but cannot compensate reduction in
current photosynthesis due to lack of soil moisture.
3-3. Correlation of measured traits for barley culti-
vars under drought stress
As can be seen in measured traits correlation table
(Table 6) in barley cultivars, there is a signi cant posi-
tive correlation between biological yield and grain yield.
FIGURE 5. Comparison of stress susceptibility index on types
Table 7. Table of average indexes of stress tolerance in evaluated barley
cultivars
Experimented
Treatments
SSITOLSTIMPGMPHARM
Types
Type 12.1401.8551.9223.8353.7973.767
Type 20.2770.1701.1103.5503.5503.550
Type 31.8251.5851.9003.7823.7603.745
Type 410.5900.8003.0253.0102.990
Type 51.8321.4801.5853.2503.2353.220
Type 61.2000.6300.6402.7102.6902.670
Type 71.8321.5101.6673.3923.3773.362
Type 81.2500.8100.9703.3303.3103.280
Type 91.6971.3671.6003.1003.0923.392
Type 100.8200.2500.2301.6201.6201.610
Posts that have common letters in each column, according to Duncan’s multiple range do not
have signi cant difference ve percent probability level.

Fatemeh Sefatgol and Hamidreza Ganjali
284 EVALUATION OF DROUGHT STRESS TOLERANCE IN ADVANCED BARLEY CULTIVARS IN SISTAN REGION BIOSCIENCE BIOTECHNOLOGY RESEARCH COMMUNICATIONS
Also there was a signi cant positive correlation between
plant height and grain yield and harvest index. In addi-
tion there is a signi cant positive correlation between
grain yield and harvest index. While there is a signi -
cant positive correlation between yield and number of
grains per panicle with the number of clusters.
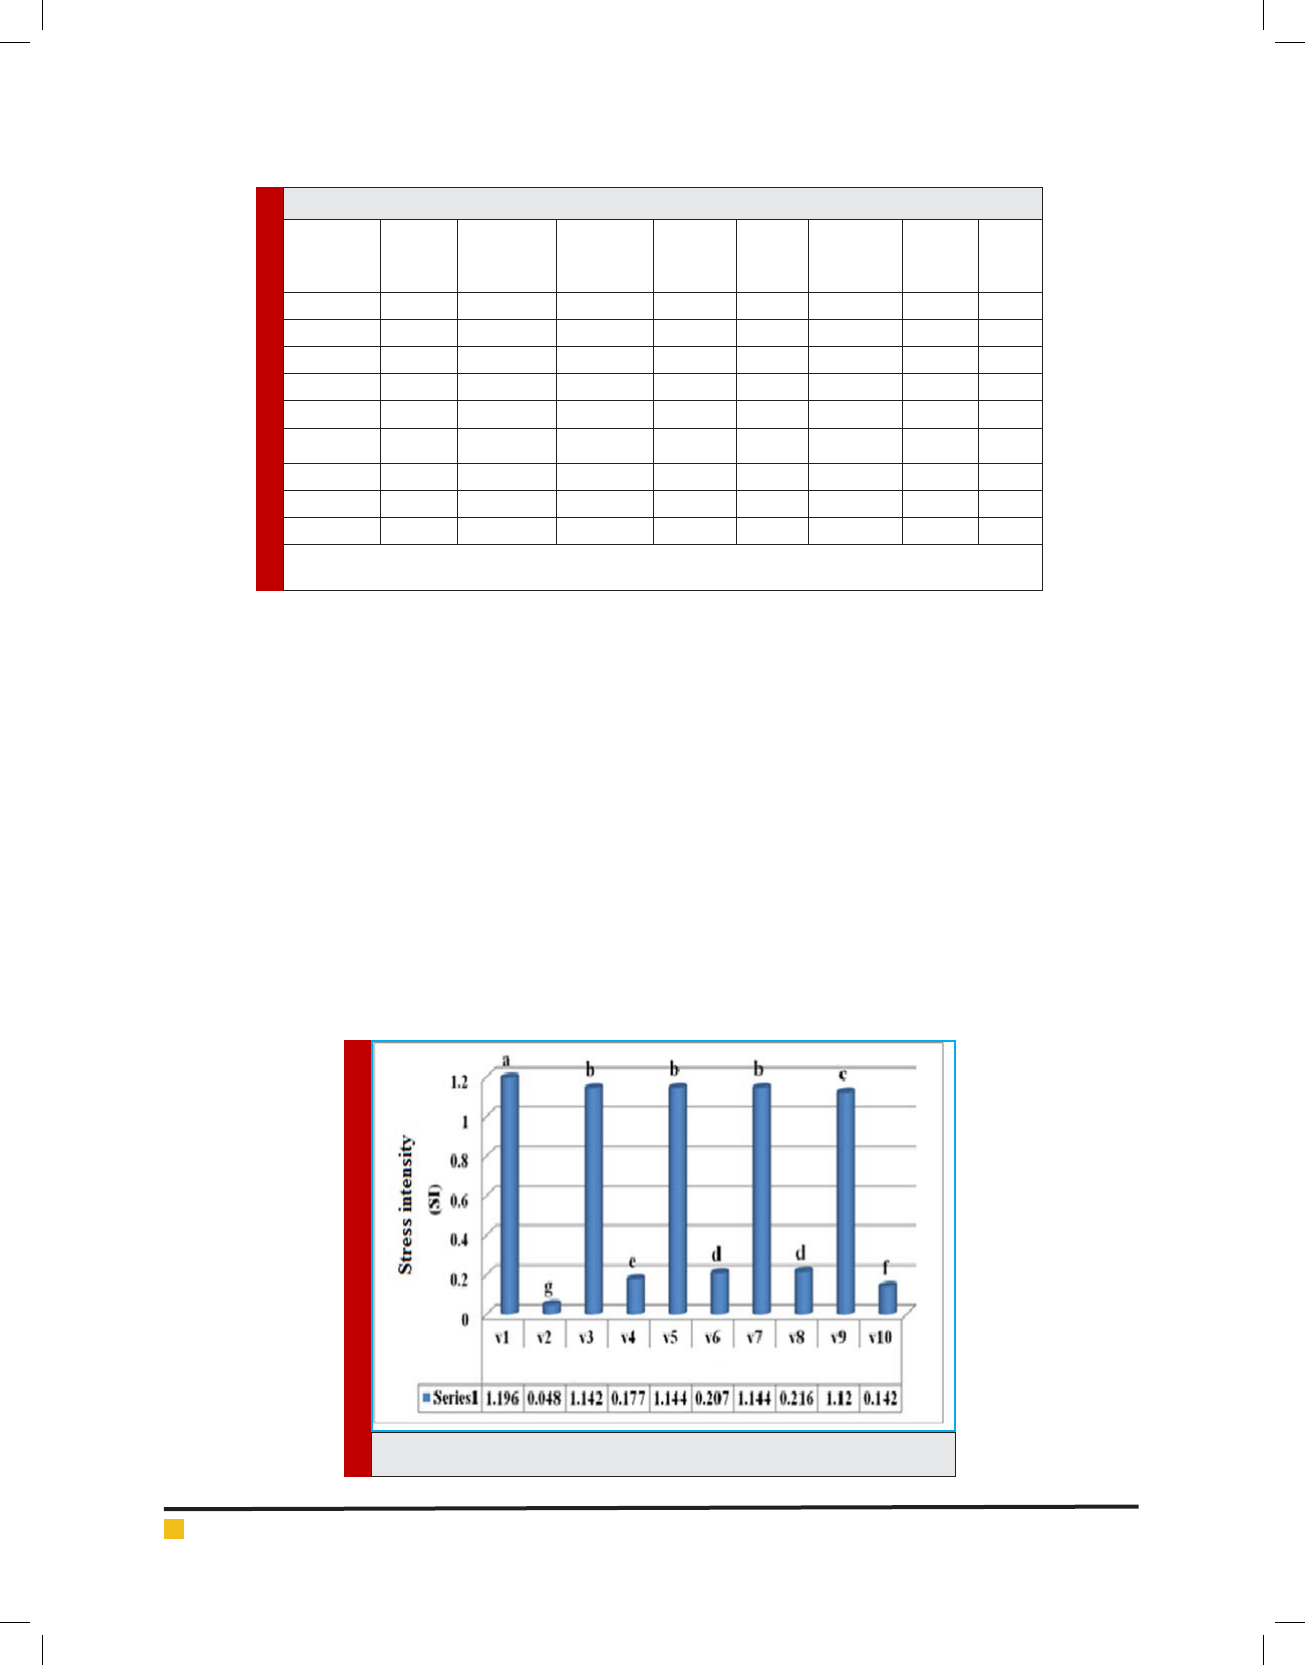
3-4. Effects of water stress index for barley
Stress intensity (SI): The results of variance analysis
shows that the stress intensity signi cant effect on type
on the statistical level of one percent (Table 7). As can
be inferred from the table of mean comparisons, maxi-
mum stress is for the Zahak with an average of 196/1
and minimum stress is for the lingnee with an average
of 048/0, respectively (Figure 4).
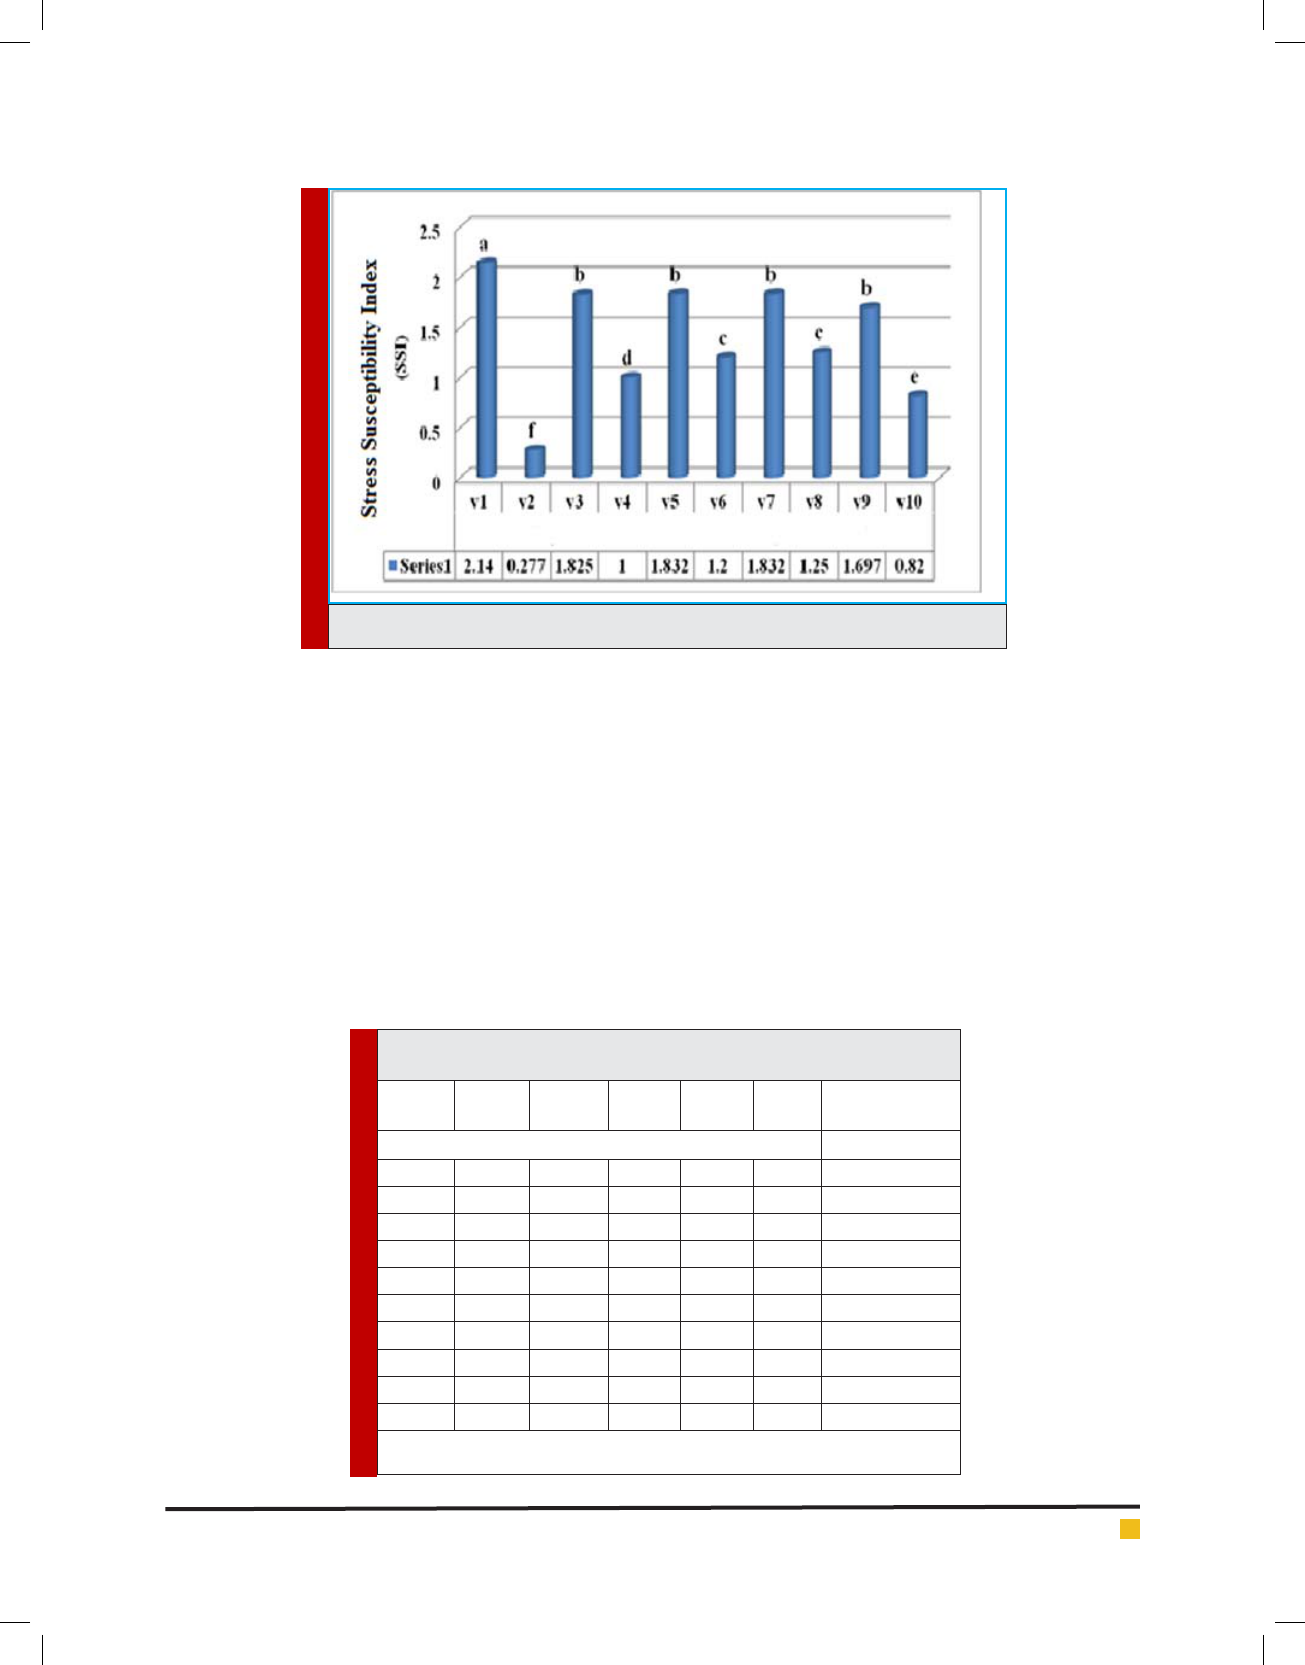
Stress Susceptibility Index (SSI)
It can beconcluded from the table of mean comparisons
that maximum stress susceptibility index for the Zahak
is with an average of 140/2 and the minimum stress is
for the lingnee with an average of 277/0, respectively
(Figure 5).
Tolerance Index (TOL): As can be inferred maximum
tolerance index is for Zahak with an average of 855/1
and the lowest tolerance index is for the lingnee with an
average of 170/0, were obtained (Figure 6).
Stress Tolerance Index (STI): As inferred, maxi-
mum stress tolerance is for the Zahak with an aver-
age of 922/1 and the lowest tolerance index is for
the Brs180 with an average of 230/0, respectively
(Figure 7).
FIGURE 6. Comparison of mean tolerance index on types
FIGURE 7. Comparison of mean stress tolerance index on types

Fatemeh Sefatgol and Hamidreza Ganjali
BIOSCIENCE BIOTECHNOLOGY RESEARCH COMMUNICATIONS EVALUATION OF DROUGHT STRESS TOLERANCE IN ADVANCED BARLEY CULTIVARS IN SISTAN REGION 285
CONCLUSION
The results of variance analysis of measured traits
showed that in normal conditions the measured traits in
barley were signi cant except thousands grain weight
and spikes per square meter.The highest biological yield
(52.3 tons per hectare), grain yield (90.3 tons per hectare)
and harvest index (40%) was obtained from the lingnee.
Also the lowest biological yield (08/3 tons per hectare),
grain yield (96/2 tons per hectare) and harvest index
(25/34 percent) was observed for the L.1242. The effect
of measured traits of barley varieties under drought
stress were signi cant only on plant height, number
of grains per panicle and panicle length, In a way that
the maximum height (25/79 cm), number of grains per
panicle (53) and panicle length (72 cm) of Violeta was
obtained. Also, the minimum height (25/87 cm), number
of grains per panicle (25/42) and panicle length (75/58
cm) was observed for the Merzaga. In addition to this
mean squared of drought stress indices for barley varie-
ties on traits such as drought stress intensity (SI), stress
susceptibility index (SSI), Tolerance Index (TOL), stress
tolerance index (STI), ef ciency index medium (MP),
geometric mean productivity (GMP) and harmonic mean
(HARM) was signi cant. The highest values of men-
tioned traits was for the Zahak in common. The low-
est stress (SI), stress susceptibility index (SSI), Tolerance
Index (TOL) to the lowest Lingnee and stress tolerance
index (STI), mean productivity (MP), geometric mean
productivity (GMP) and the harmonic mean (HARM) was
observed for the Brs180. It seems that due to the favora-
ble climatic conditions of this irrigation treatment for
the Lingnee had a positive effect on growth and caused
maximum length and height of this type. The increase
in height and growth will increase leaf area and thereby
cause an increase in photosynthesis which will result
higher dry matter production and yield. Accordingly, the
maximum biomass is observed in this treatment. It could
be said that higher biological yield of Lingnee is because
of its genetic and physiological traits that is associated
with the period of further growth and production of till-
ers. Higher grain yield than other cultivars in Lingnee is
because of higher yield components in this type. Since
the yield of plants is in uenced by cultivar and envi-
ronmental conditions, it can be said that plants reaction
about the yield and yield components is mostly affected
by numerous factors including the type of plant, growth
period, soil texture, soil fertility status and weather con-
ditions. It seems genetic potential of Lingnee, through
a greater impact on increasing the economic yield of
the biomass has been able to raise the value of the har-
vest index in this type. In other words, plant does not
produce additional dry matter, but a large part of the
economic yield is allocated to economic performance of
grain. Based on stress tolerance index (STI) Zahak varie-
ties is one of the types with highest tolerance to drought
stress. Finally, it is suggested that more varieties will
be examined and sustainability indices be used in these
experiments.
REFERENCES
Ahmed, J. Zeynali Khangah, H. Rostami, M. And Choukan,
R, 2010. Evaluation of drought resistance in corn hybrids late
trade. Iranian Journal of Agricultural Sciences, Issue 4, Pages
899-891.
Ardalan, V. Aghayari, F. Paknejad, P. Sadeghi Shoa, D. Ismail-
Zadeh Khorasani, N. And Fatemi Rekia, Z, 2014. Effect of
de cit irrigation and irrigation practices on yield and yield
components of two maize varieties. Journal of Agriculture and
Plant Breeding. Volume 8, Issue 3, pp. 189- 175.
Arshi. Y, 1994. Sun ower Science and Technology (Transla-
tion). The Head Of ce of Iranian oil, cotton and grain. 717 pp.
Bradford, k.j.2004. water stress and the water relation of seed
development. A critical Review. Cropsci.
Chapman, S. C., Crossa, K. Basford, E. and Kroonenberg, P.
M. 2007. Genotype by environment effects and selection for
drought tolerance in tropical maize: Three – mode pattern
analysis. Euphytica 95 (1): 11-20.
Dixon, F. L. and L. Luteman. 2004. Effects_of_drilling_date on
growth and yield of sun ower in the U.K. J. Agri. Sci. 19 (2):
197-204.
Eck, H.V. 2004.Irrigatied corn yield response to nitrogen and
water. Agronomy Journal 76 (3): 421-428.
Farbodnia, T. 2005. Effects of water stress on germination,
growth and some biochemical changes caused by tension in
the Iranian chickpea. Master of Science thesis in Biology Plant
Sciences. Tarbiat Moallem University of Tehran.
Fard, E. M., Bakhshi, B., Keshavarznia, R., Nikpay, N., Shah-
bazi, M., & Salekdeh, G. H. (2017). Drought responsive microR-
NAs in two barley cultivars differing in their level of sensitiv-
ity to drought stress. Plant Physiology and Biochemistry. 118,
121–129
Flenet .F. 2003 . Partitioning of stored and current assimilates
in sun ower as in uenced by timing of water stress . Agricul-
tural Meditterranea . 127 (4) : 306-312 .
Goksoy, A. T., A. O. Demir, Z. M. Turan and N. Dagustu.2004.
Responses of sun ower to full and Limited irrigation at differ-
ent growth stages. Filed Crops Res. 87: 167-178.
Gomez , D., O.Marinez ., M.Arnon ., and Castro. L. 2003 . Gen-
erating a selection index for drought tolerance in sun ower .
II. Water use and consumption . Helia . 15 : 65-70 .
Jafarzadeh Knarsry, M & Poostini, K. 2004. Effects of water
stress in different growth stages on some morphological char-
acteristics and yield components of sun ower, Iranian Journal
of Agriculture Science, Volume: 29 .No 2, pp. 353- 361.
Javadi, T., Rohollahi, D., Ghaderi, N., & Nazari, F. (2017). Miti-
gating the adverse effects of drought stress on the morpho-

Fatemeh Sefatgol and Hamidreza Ganjali
286 EVALUATION OF DROUGHT STRESS TOLERANCE IN ADVANCED BARLEY CULTIVARS IN SISTAN REGION BIOSCIENCE BIOTECHNOLOGY RESEARCH COMMUNICATIONS
physiological traits and anti-oxidative enzyme activities of
Prunus avium through -amino butyric acid drenching. Sci-
entia Horticulturae, 218, 156-163.
Kazempour, S. Tajbakhsh, M. 2001. Some anti-transpiration
effect on growth characteristics, yield and yield components of
maize under limited irrigation. Iranian Journal of Agricultural
Sciences. Vol 33 (2): 211-205.
Koochaki, A. 2003. Organic farming of Esfarzeh and Pytaniom
in response to water stress. Iran arable Journal, No 2 (1), pp.
111-103.
Paknezhad, F, 2000, Evaluation and comparison of the perfor-
mance of different forage sorghum hybrids in different den-
sities, Crop Science Society of Iran. Iranian Journal of Crop
Sciences. Volume III. No 1, pp. 32 to 37.
Sarmadnia, Gh.h and Koochaki A, 2002. Crop Physiol-
ogy (Translation). Mashhad University, Jahad Daneshgahi
Press.
Sheikh Atabak, A, 2004. The effect of drought on physiologi-
cal characteristics and activity of antioxidant enzymes in pea
varieties. Master’s thesis.
Simane, B., J. M. peacock, and p.c struik.2003. Differences
in developmental plasti city and growth rate among drought
resistant and susceptible cultivars of durum wheat. Plant and
soil- 157:155-166.