
Pharmaceutical
Communication
Biosci. Biotech. Res. Comm. 9(4): 841-849 (2016)
Development of HPTLC methods for isolation and
characterization of botanical reference material of
Avicennia marina
stem
Vinars Dawane and M. H. Fulekar*
School of Environment and Sustainable Development, Central University of Gujarat, Gandhinagar – 382030,
Gandhinagar, Gujarat, India
ABSTRACT
In this study an attempt has been made to develop the strategy of HPTLC method forseparation – isolation of a
selected botanical reference material (BRM)band from the methanol extract of Avicennia marina stem, followed by
HPLC-MS method for further elucidation of physical identi cation. The HPTLC isolation method was optimized in the
form of band selection, mobile phase selection and followed by preparative HPTLC parameters optimization (sample
volume, TLC plate development chamber saturation time, relative humidity and temperature). The band was selected
under UV – 336 nm. The band gave a compact RF max value of 0.65 with optimized chloroform: ethyl acetate (4:6)
mobile phase. Optimized volume for preparative HPTLC study was found 180 µl on 160 mm the band length. The
chamber saturation time optimized to be 25 minutes. All experiments were performed under temperature – 23.9 0C
(constant) and relative Humidity – 69 % (constant). As a result a quick, simple, reliable, reproducible and cheap pre-
parative HPTLC method was developed for isolation of that selected band. Further HPLC-MS analysis of that isolated
band shown the presence of two major peaks (botanical reference compounds) in that separated-isolated band and
revealed their speci c retention time (Rt = 11.271 and 12.418 respectively) in the column and molecular mass/charge
ratio (293.1521 and 548.2242 respectively) and molecular formula by the mass spectroscopic study.These selected
studies will serve as the bases of robust methods for isolation and stability checking studies of botanical reference
materials from this mangrove as well as other plants and will open the scope of new BRMs, further bioactivity study
and their chemical structure elucidation from their extracts or other formulations.
KEY WORDS: AVICENNIA MARINA STEM, ISOLATION, SEPARATION, PREPARATIVE HPTLC, HPLC-MS, METHOD DEVELOPMENT
841
ARTICLE INFORMATION:
*Corresponding Author: mhfulekar@yahoo.com
Received 26
th
Nov, 2016
Accepted after revision 27
th
Nov, 2016
BBRC Print ISSN: 0974-6455
Online ISSN: 2321-4007
Thomson Reuters ISI ESC and Crossref Indexed Journal
NAAS Journal Score 2015: 3.48 Cosmos IF : 4.006
© A Society of Science and Nature Publication, 2016. All rights
reserved.
Online Contents Available at: http//www.bbrc.in/

842 DEVELOPMENT OF HPTLC METHODS FOR ISOLATION AND CHARACTERIZATION BIOSCIENCE BIOTECHNOLOGY RESEARCH COMMUNICATIONS
Vinars Dawaneand M. H. Fulekar
INTRODUCTION
The chemicals of natural origin have always been eye
catching center for drug discoveries and remediesbe-
cause they are unique, complex, diverse, effective and
strong candidate to create leading edge drugs and front
line treatments (Clardy& Walsh, 2004; Newman&Cregg,
2007;Butler & Newman, 2008 and Newman &Cragg,
2016). Howevertransform these natural products or
botanicals into remedies or drugs is not easy and still
a challenging job (WHO, 2001;Xie et al., 2006;Bucar et
al., 2013).Achieve the best methodologies for separation,
isolation, puri cation and further characterization, has
always been a very critical, analytical task (Sasidharan
et al., 2011;Nikam et al., 2012;Brusotti et al., 2014).
Ef cient and novel analytical strategieshave been-
continuously needed for almost every new phytocom-
pounds for their rapid enrichment, separation and isola-
tion (Chen et al., 2014).
In this current scenario, various harmful effects
like allergy, safety and microbial resistance etc. made
a switch and a strong return from synthetic medicines
to herbal drugs, phytotherapy and enthnomedicines
(Calixto, 2000). The adverse effects of plant remedies
found to be far less as compare to synthetic drugs (Ernst,
2003) but safety has always been in concern(Ernst,
2002; Chan, 2003). These reasons directed, herbal
drugs towards the solution of sophisticated analytical
standard methods for their proper separation, isolation
– identi cation,safetyand expected therapeutic effects
(Waksmundzka-Hajnos et al., 2008).
In this outlook, HPTLC and/or HPLCare tremen-
dously useable (Wilson,1999;Xie et al., 2006;Tistaert,
et al., 2011; Loescher et al., 2014) and their various
combinations with recent analytical techniques has
been extremely indispensable and very much regu-
lar now a day for herbal analysis(Morlock&Schwack,
2006;Bimal&Sekhon, 2013; Riffault et al., 2014).
The Avicennia marina stem/bark/twig or Heartwood, has
been an interesting candidate itself fora wide range of
medicinal properties (Thatoi et al., 2016) and reported bio-
active compounds (Han et al., 2007; Zhu et al., 2009;
Mohammed et al., 2014; Jain et al., 2014).
The main objective of this study was to develop the
strategy ofpreparative HPTLC method forseparation –
isolation of selectedbotanical reference material (BRM)
from the methanol extract of Avicennia marina stem,
followed by HPLC-MS methodfor further elucidation of
physical identi cation. The present study may serve as
the bases forthe use of HPTLC as fast, cheap, accurate
and robust method for separation - isolation and sta-
bility checking studies of botanical reference materials
from Avicennia marina stem as well as for other plants
and will open the scope of discovering new BRMs and
their chemical structure elucidation.
MATERIALS AND METHODS
COLLECTION AND IDENTIFICATION
The Avicennia marinawas collected in January 2014 from
the S.P.Godrej Marine Ecology Centre, Vikhroli, Mum-
bai city of Maharashtra, India (Geographical coordinates
19˚05’50.82˚N – 72˚56’24.06 ˚E). The plant materials were
identi ed and authenticated by the same institute.
EXTRACTION OF PLANT MATERIAL
The stem was shed dried for 15 days and grounded by
mechanical grinder into coarse particles. 500 mg of stem
power was mixed with 10 ml methanol. Theextract was
sonicated for 6hours until it became clear or colorless.
Direct sun light and high temperature were avoided to
protect heat sensitive phytochemicals. Extracts were l-
tered through Whitman No.1 lter.
CHEMICAL AND EQUIPMENT
CAMAG HPTLC system equipped with automatic TLC
sampler LIMONATE V, TLC scanner 3, REPROSTAR 3
with 12 bit CCD camera for photo documentation analy-
sis, winCATSsoftware. All the solvents used for HPTLC
analysis were HPLC analytical grade obtained from
Merck, India.
Scissor, beaker (50 ml), HB – pencil, water bath, chlo-
roform, Ethyl acetate, methanol, sonicator, hand glows,
Whitman lter paper (no. 1 and 42). HPTLC Aluminum
plate silica gel 60F
254
precoated 20 x10 cm (Batch no.
- 1.05554.0007 – HX360380).The HPLC – column was
“Zorbax SB_ C 18 (2.1 X 100mm, 1.5 micron pore size)”
and Mass spectroscopy (software – Agilent Mass Hunter
qualitative analysis B.06.00).
FIGURE 1. Avicennia marina mangroves
present in Godrej Marine Ecology Centre,
Mumbai, Maharashtra.
Apart from traditional and folk medicinal uses,Avicennia
marina found to be a gorgeous source of signi cant natu-
ral structures, among them most of observed high phar-
macological values (Rui et al., 2004 and Zhu et al., 2009).

BIOSCIENCE BIOTECHNOLOGY RESEARCH COMMUNICATIONS DEVELOPMENT OF HPTLC METHODS FOR ISOLATION AND CHARACTERIZATION 843
Vinars Dawaneand M. H. Fulekar
HPTLC PROCEDURE
HPTLC study with different mobile phasesfor stem meth-
anol extract were performed on commercial Aluminum
– shits precoated with silica gel 60 F
254
HPTLC plates
(Merck). First of all 20 x 20 cm plates were cut down in
to the 10 x 10 cm plate with the use of a scissor. Before
using it for sample applicator, plates were checked in the
254nm, whether they were giving uorescence or not
and marked the limit of run and direction by a pencil.
After it, a working program was generated with the use
of winCATS software. Speci c volume of sample was
taken by the use of 100 µl Hamilton Syringe and applied
(basically 10 µl) on plate as the prede ned 8mm band
length by the means of CAMAG LINOMATV sample
applicator.
After the completion of the sample applicator pro-
gram the plate was subjected for drying with the use of
a drier and then placed on to CAMAG plate heater for
10 minutes for remove any water or moisture content
from the plate. The speci c mobile phases (Tab.3) were
prepared according to maximum separation and to nd
better candidate for isolation of selected band. Mobile
phases were separately subjected to the CAMAG Twin-
Through chamber for 20 minutes. A lter papered rinsed
with mobile phase was also subjected in the chamber for
a uniform vapor saturation of the chamber prior adding
of the sample applied plate.After the 20 min saturation
of the CAMAG Twin- Through chamber, the plate was
placed in it, till the solvent front reached up to the dis-
tance of 80mm (previously marked). This process took
5 – 8 minutes to develop the plate depends on the inter-
actions of mobile phase, stationary phase and sample
molecules.After development, the plate was subjected
for drying by hot air device (drier) and 10 minutes on
CAMAG plate heater (110
0
C) at room temperature and-
kept it for documentation in the CAMAG TLC visualizer.
This visualizer captured the images under 366nm (Flu-
orescence) and densitometry analysis was done under
366 nm (Hg - lamp). In the last step the plate was deri-
vatized with AnisaldehydeSulphuric Acid reagent (ASR)
in the derivatizating chamber for 3-4 seconds and air
dried. After drying, the plate was heated on CAMAG
plate heater for 3-4 minutes at 110
0
C. Final image was
quickly captured by the CAMAG TLC Visualizer under
orescence (366 nm).
1. Isolation of a Botanical Reference Material (a single
band) by HPTLC
A magical concept is that, different compounds can
travel a different distance in the stationary phase on TLC
plate, so chromatography can be used as an effective
isolation procedure
(Reich and Schibli, 2007). Among
these separated compounds, each occupy a de nite
area on the TLC plate and they can be easily scraped
away manually rom stationary phase and nally re dis-
solved it into solvent to become as sample for further
analysis.
Band selection and Mobile Phase Optimization – The
band was selected from the ngerprinting pattern of
Avicennia marina stem (under – 366 nm). The band was
seen only under low energy zone (UV – 366 nm) (Fig.
2).The four mobile phases (M.P.) were selected for nd-
ing desirable compact R
F
max value (Tab. 3) and better
separation.
Saturation Time Optimization – The optimizations were
made in chamber saturation time. In the ve different
experiments on HPTLC plat 10 X 10 cm, the saturation
time was increased in the ascending order from 10 min-
utes, 15 minutes, 18 minutes, 25 minutes and 30 min-
utes. The procedure was same.
Preparative HPTLC volume optimization – The sample
volume was optimized for preparative HPTLC isolation
of desired band. In this experiment, the volume of Avi-
cennia marina stem aliquots of 5l, 10 l, 15 l, 20 l
and 25 l were loaded in the increasing order and a TLC
plate 10 X 10 cm and was run with optimized parameters
of mobile phase (M.P. 3) and saturation time (25 min-
utes). TheTemperature and relative humidity were 23.9
0C and 69 % respectively maintained constant.
Developing, Marking, Cutting and Re dissolving the
compound for analysis and stability test – The plate was
developed in Twin – through chamber and mobile phase
was Chloroform: Ethyl acetate (4:6). Marking of desired
band was done by hands, with HB - pencil under the UV-
366 nm on Hg lamp (Fluorescence mode).Cutting was
done by scissor.Re dissolving of isolated powered com-
pound was done in the 50 ml beaker and cut plates were
dissolved in the methanol (HPLC grade) and sonicated
for 2 hours. The overnight extraction was performed. For
puri cation Whitman no.1 ltration used for lter trace
of graphite of pencil and Si gel. Whitman no. 42 ltration
used for lter the Si gel and got colorless solution.
2- Dimensional Chromatography for stability detec-
tion –The possibility of sample degradation was also
investigate by 2 D run. The Concept was, a stable com-
pound will give same R
F
in both two development and
form a straight line connecting the application position.
Stability test also give the information of the waiting
time and the robustness of the method of isolation.
2. Identi cation with already known compounds
library by GC –HR- MS and HPLC-HR-MS detection
–The both studieswere carried out in SAIF, IIT Bombay.
For GC, 2 µl sample was taken by the syringe (Agilent
PN – 5190 – 1483, made in Australia) and applied in to
844 DEVELOPMENT OF HPTLC METHODS FOR ISOLATION AND CHARACTERIZATION BIOSCIENCE BIOTECHNOLOGY RESEARCH COMMUNICATIONS
Vinars Dawaneand M. H. Fulekar
the GC – applicator (Agilent Technologies 7890 A). A
working program was generated (See table.3.2).
For HPLC, 5µl sample was taken by the syringeand
applied in to the LC – applicator (Agilent Technologies).
The column Zorbax SB_ C 18 (2.1 X 100mm, 1.5 micron
pore size) was used. A working program was generated
for mobile phase composition (See table.1).
authentication and separation of its botanical reference
materials (BRM) (Dawane et al., 2016).In this present
research, we further elucidated our study in the form of
isolation and physical detection of selected band among
separated compounds on TLC plate. The Toluene: Chlo-
roform (6:4) solvent system has been applied initially
for development of a basic chromatogram and the o-
rescentband (under 366 nm) was selected for isolation
study (Fig. 1). This band found to be prominent peak at
the R
F
max of 0.67 (Fig.2).
Table 1: The protocol of GC – MS working program.
The temperature, time duration and the temperature
increasing speed is present.
Temperature Duration of
time
Temperature
increment speed
70 0C
(initial temperature)
1 minutes 6 0C per minute
200 0C 3 minutes 10 0C per minute
260 0C 3 minutes 10 0C per minute
280 0C HP 5 Neat.
Table 2: This table is showing the solvent
composition and its time duration as mobile
phase. Where, A – 100 % Millipore water + 0.1
% formic acid and B – 100 % acetonitrile + 10
% water + 0.1 % formic acid.
Time Solvent composition
2 minutes A = 95 % & B = 5 %.
25 minutes A = 0 % & B = 100 %.
30 minutes A = 0 % & B = 100 %.
32 minutes A = 95 % & B = 5 %.
RESULTS AND DISSCUTION
Avicennia marina stem is a well known source of vari-
ous phytochemicals and HPTLC has been found useful
technique to assess the phytocompounds (Dawane et al.,
2016).
Previously we studied the HPTLC pattern assessment
of Avicennia marina stem and provided the method for
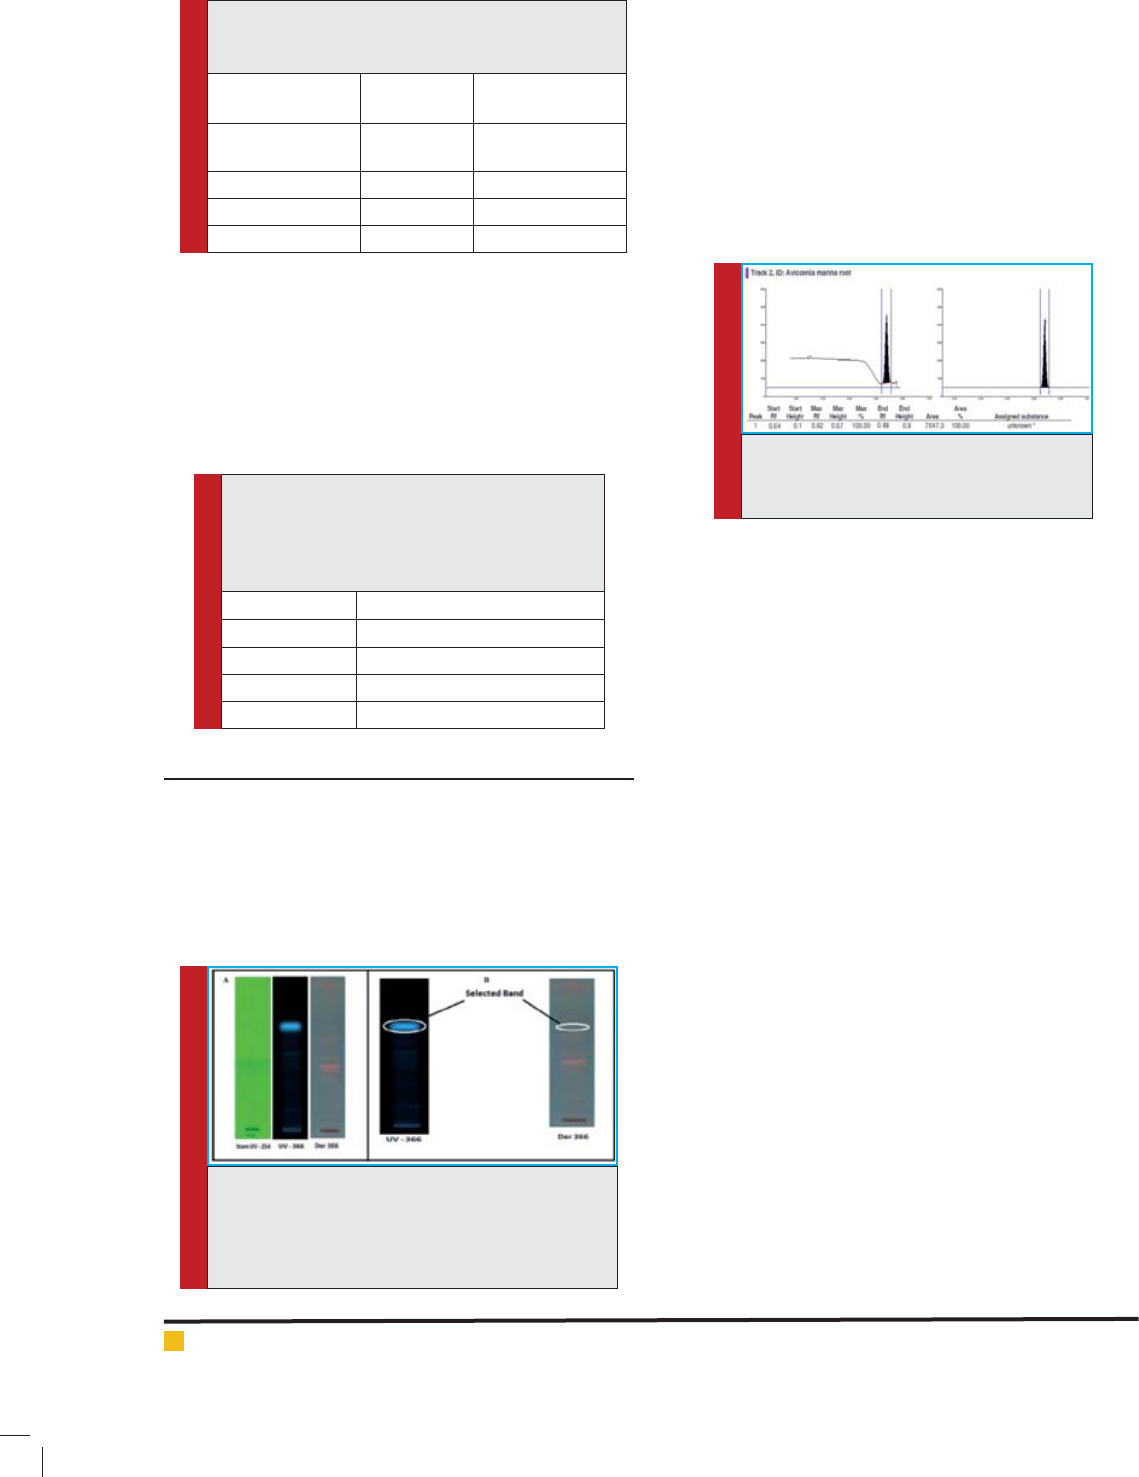
FIGURE 2. Developed plate under various energy
zones. Here, A - HPTLC pattern of methanol sample
in Toluene: Chloroform (6:4) and B - Selected band
on TLC plate under UV- 366 nm before and after
derivatization.
FIGURE 3. Densitogram ofselected band
under UV- 366 nm and its RF max was 0.67
(in Toluene: Chloroform 6:4).
This compound may be the main component (sig-
ni cantly more abundant than other components) or
major active principle or active ingredient or the marker
compound of this extract because the detected peak has
found to be prominent (Li et al., 2008) under low energy
zone (UV – 366 nm) and densitogram showed 7647.30
area unit (AU) concentration in 10 l sample of 8 mm
band length, other peaks were extremely minor or under
below the detection limit (<500AU) (Fig.2B and 3).
The understanding about marker compound has been
also very essential because from this,one can validate
the effectivenessof extract as well as some times marker
compound can also be acts as active principle of raw
material for its correctbotanical identity check (Tistaert
et al., 2011; Rasheed et al., 2012) but as well know sin-
gle active constituent isn’t always responsible for overall
ef cacy (Xie et al., 2006) so the statement is not perma-
nentlyright (Ruiz et al., 2016).
Multiple active phyto components or poor separation
also made it dif cult to nd and isolate markers. The cer-
tainty and probability of chromatographic outcomes has
somewhat restricted, and for this reason method devel-
opment remained an extensively empirical procedure
(Ong, 2004;Xie et al., 2006; Reich and Schibli, 2007),
so four different mobile phases (Tab. 3) has been used
to develop and compare the HPTLC pattern of selected
band to get a good separation along with compact R
F
Max value of selected band ( g. 4).
After testing these 4 mobile phases, 3rd and 4th
mobile phases were chosen for further studies because
these two mobile phases gave comparably better results
BIOSCIENCE BIOTECHNOLOGY RESEARCH COMMUNICATIONS DEVELOPMENT OF HPTLC METHODS FOR ISOLATION AND CHARACTERIZATION 845
Vinars Dawaneand M. H. Fulekar
and it was also previously known that mobile phases
with acidic or basic modi ersor other polar solvents
(mobile phase 1 and 2), were avoided in the HPTLC iso-
lation studies because it re ects the stability of isolated
compound and may degrade the compounds sometimes
as well as affects the “clarity” of generated pattern (Reich
and Schibli, 2007).
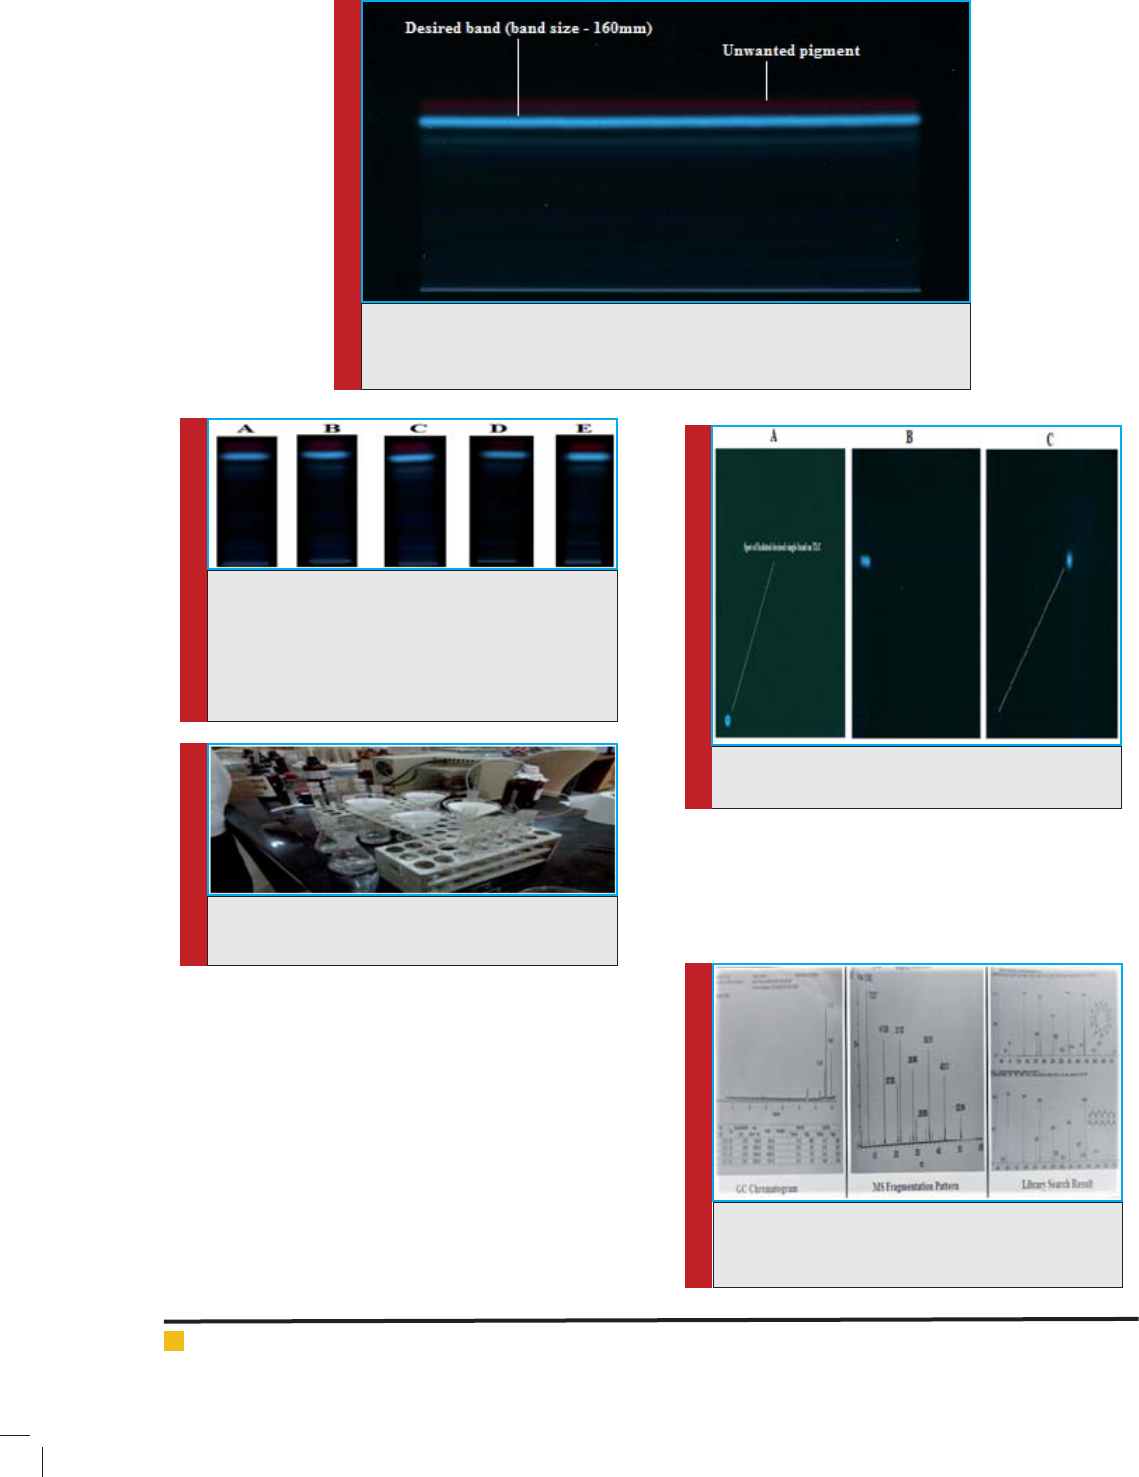
After volume optimization the preparative HPTLC on
160 mm band size clearly showed the presence of desir-
able band (R
F
Max value 0.65) along with unwanted pig-
ment on just top (Fig. 6). Most of times ne tuning were
performed in the method development for this kind of
adjustments in the generated patterns. For this, addi-
tions of modi ers in solvent systems or chambers satu-
ration time variations often applied (Reich and Schibli,
2007). To increase the distance between the desired band
and the unwanted pigment, chamber time saturation
experiment was performed and as anoutcome, 25 min-
utes saturation gave the best results (Fig. 7).
After these, the plates were marked, Cut and re dis-
solved and extracted in methanol (Fig. 8). These gave
a sample, how’s stability and degradation were further
FIGURE 4. Mobile phase optimization plate.
Here A, B, C, D were mobile phase 1, 2, 3
and 4 respectively. Pictures under UV – 366
nm before and after derivatization with
ASR. The image B derivatized with FeCl3
under white light.
Table 3: The 4 different mobile phase compositions
used for optimization.
Mobile Phase Composition
1
Cyclohexane : Ethyl acetate : Formic
acid (4:6:1)
2
Toluene: Ethyl acetate : Formic acid
(4:6:0.3)
3 Chloroform : Ethyl acetate (4:6)
4 N- Hexane : Ethyl acetate (1:1)
As we could see in the picture (Fig.4, 5B) one red pig-
ment (may be chlorophyll / xanthophyll) found to bev-
ery near from our desired band, which could be interfere
in our results. So 3rd mobile phase (belonging to middle
polar range) was preferred rather than 4th one (belong-
ing to lower polar range) and optimized for isolation of
selected botanical reference compound band on the TLC
plate.
After mobile phase optimization the volume for pre-
parative HPTLC was optimized to develop a sample for
further analysis. The various volumes 5 µl, 10 µl, 15 µl,
20 µl, 25 µl used in the increasing order (the band width
was 8 mm) and area peaks were calculated under UV-
366 nm (Fig.5 and Tab.4).
With the help of densitogram the sample volume
180μl, was nalized with the band length of 160 mm
on TLC plate (Fig. 6), and the three consecutive turns of
TLC plate were used togenerate the sample for further
studies.
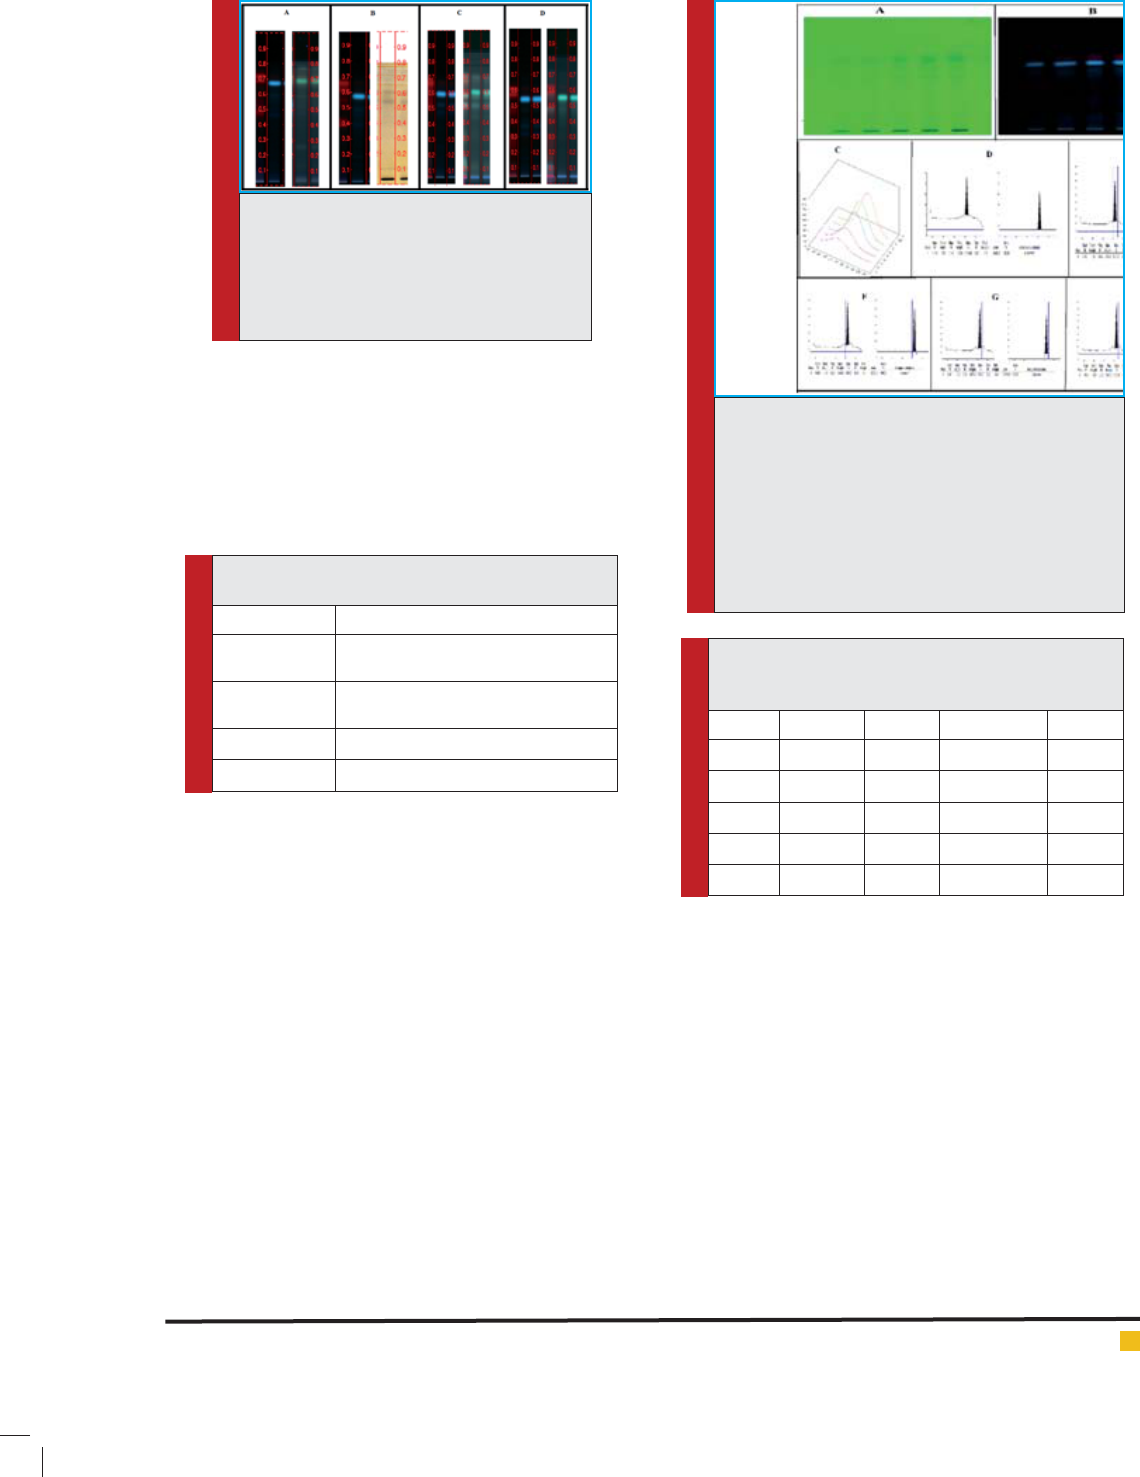
FIGURE 5. Volume optimization (in M.P. - 3). Here
A and B – volume optimization plate under UV-254
nm and UV-366 nm respectively. C – Densitogram
of various volumes 5 µl, 10 µl, 15 µl, 20 µl, 25 µl
in the increasing order (the band width was 8 mm)
and area peak is calculated at 366 nm. D,E, F, G and
H were densitometrical peaks of 5 µl, 10 µl, 15 µl,
20 µl, 25 µl volume respectively. (Band length was
8 mm).
Table 4: Various volume of sample, corresponding
RFvalues of selected band, max Height and Area
calculation results.
Figure Volume RF Max Max Height Area
D 5 µl 6.3 179.6 4502.0
E 10 µl 6.4 296.8 7455.7
F 15 µl 6.5 534.0 12775.6
G 20 µl 6.5 637.6 15576.9
H 25 µl 6.5 691.6 17531.5
Vinars Dawaneand M. H. Fulekar
846 DEVELOPMENT OF HPTLC METHODS FOR ISOLATION AND CHARACTERIZATION BIOSCIENCE BIOTECHNOLOGY RESEARCH COMMUNICATIONS
FIGURE 6. Volume optimization.Optimized volume was 180 µl and the band
length is 160 mm on TLC.[Temperature – 23.9 0C (constant) and Relative
Humidity – 69 % (constant)].
FIGURE 7. Chamber saturation time optimization
plates. Here A, B, C, D and E were chamber satura-
tion time in the ascending order from 10, 15, 18, 25
and 30 minutes respectively. [Temperature – 23.9
0C (constant) and Relative Humidity – 69 % (con-
stant)].
FIGURE 8. Setup of extraction, isolation and puri -
cation after plate cutting.
FIGURE 9. Two dimensional chromatography
results.
checked with two dimensional chromatographically
studies. The single band spot with two dimensional
development con rmed the perfect isolation of desired
band with any seen unwanted pigments (Fig.9). This kind
of experiments has been extremely important because
not only provide robustness of the method but also
determine the proper waiting times for open handed or
semi open handed analytical method like HPTLC (Reich
and Schibli, 2007).
As we know HPLC and GC were extremely sensitive
analytical technique and very small amount of sam-
ple can be detectable in both methods (Waksmundzka-
FIGURE 10. GC results. The Gas chromatogram, MS
fragmentation pattern and already existing com-
pounds library research results.
Hajnos et al., 2008; Tistaert et al., 2011), sothe three
runs of 180 μl sample with the 160 mm band size plates
were cut and re-dissolved in the methanol to make the
sample for GC-HR-MS and HPLC – HR-MS for further
characterization.
Vinars Dawaneand M. H. Fulekar
BIOSCIENCE BIOTECHNOLOGY RESEARCH COMMUNICATIONS DEVELOPMENT OF HPTLC METHODS FOR ISOLATION AND CHARACTERIZATION 847
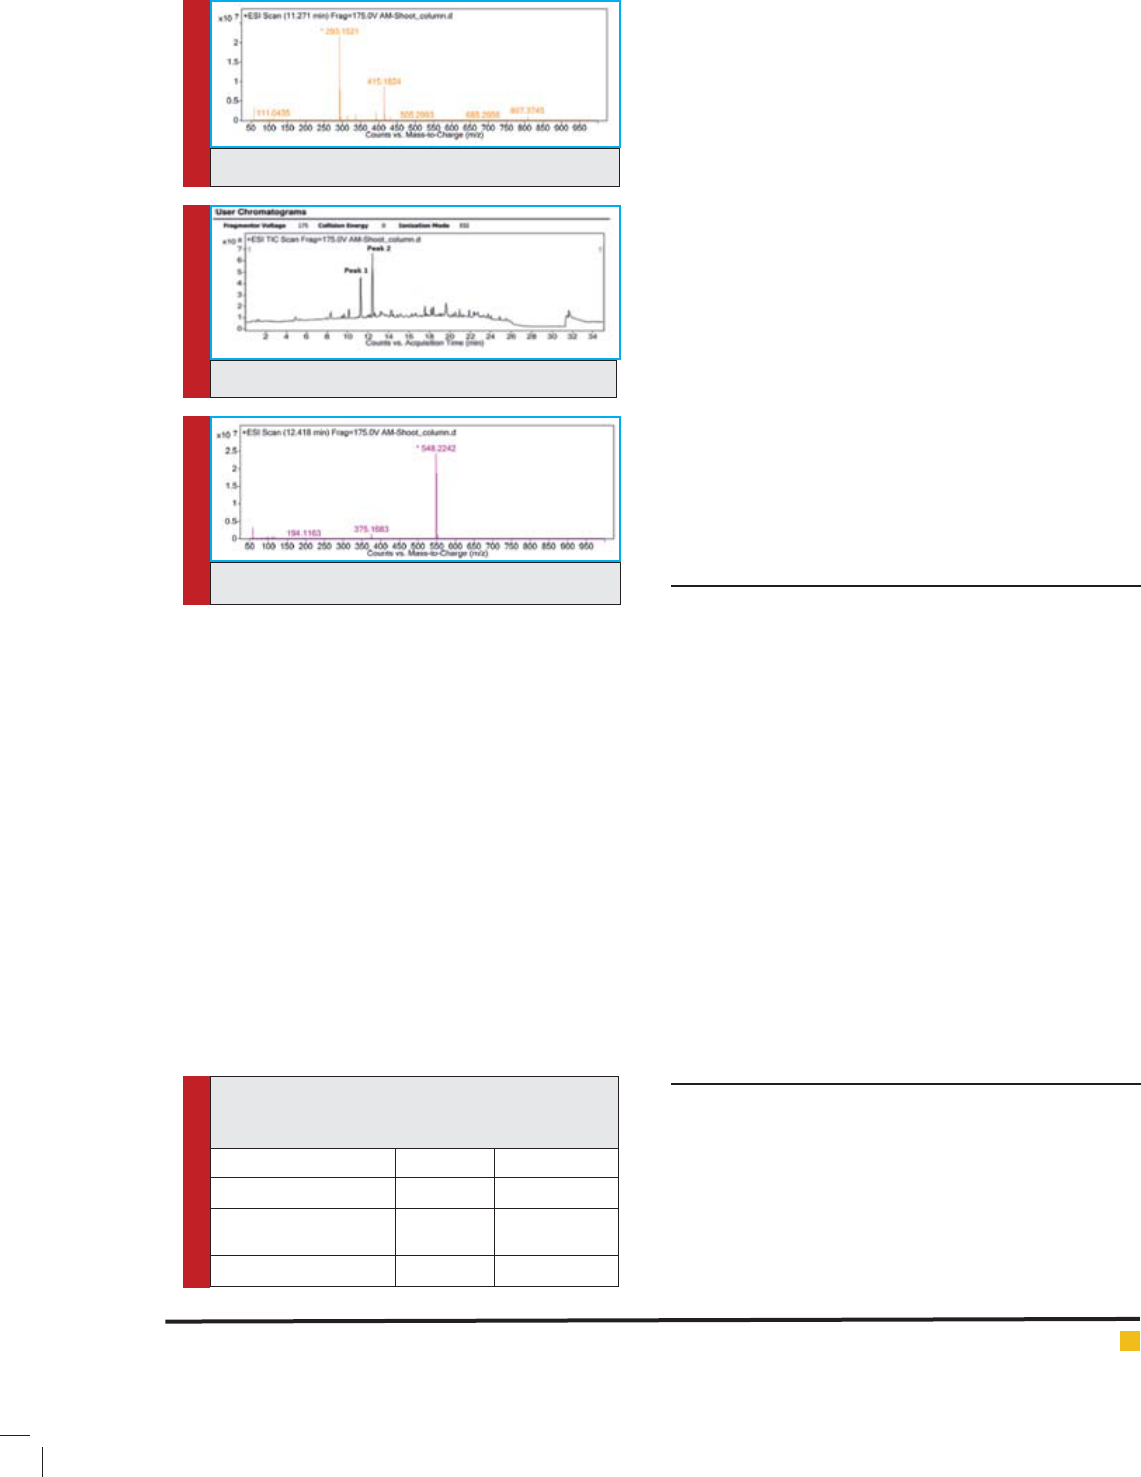
chromatogram revealed two major peaks (Fig.11) and
HR – MS of two detected peaks are shown (Fig. 12 and
13 respectively). This study elucidated Rt, mass / charge
ratio and molecular formula results of two major peaks
(Tab. 5).
The results from HPLC – MS revealed two strong
marker or active compounds in one single isolated
HPTLC band. It may be possible that these two com-
pounds are coexisting in nature and providing stability
to each other after isolation. It is also observed in the
nature that plant’s coexisting chemicals or compounds
often mitigate their negative effects or unwanted side
effects (Hanjos et al., 2008) so the results opened the
gates of further studies related to their combined and
separated effects and exact chemical structures elucida-
tion for better assessment of the nature’s experiment on
this coexisting compounds. Further studies are recom-
mended to assess the identity and accurate composition
of these two major peaks present in the single isolated
HPTLC band, in order to obtain the their bio-chemical
effects.
CONCLUSION
Variability and multiple complexities are the nature
of Herbal medicines and their drugs. Hence it is very
important to apply reliable chromatographic methods to
study the accurate separation and isolation. For these
reasons HPTLC, HPLCand their various combinations
became very useful techniques for herbals now a day
for patterns generation, separation and further isola-
tion.In conclusion, very simple, quick, precise and cheap
HPTLC method was developed and optimization of vari-
ous HPTLC parameters has been discussed for isolation
of selected botanical reference material from Avicennia
marina stem in this study as well as optimized HPLC
– HR – MS method also developed to analyze the sepa-
rated band. Further studies are suggested to structure
prediction and elucidation - characterization and to
understand the biological and pharmacological nature
of isolated compounds.
ACKNOWLEDGEMENT
Authors are thankful to S.P. Godrej Marine Ecology
Center, Vikhroli, Mumbai for Avicennia marina sample
collection and also thankful to ANCHROM HPTLC labs,
Mulund, Mumbai for providing HPTLC facilities during
this research and SAIF - IIT Bombay for GC/HPLC –MS
analysis. Mr. VinarsDawane is thankful to UGC, New
Delhi for the award of Rajiv Gandhi National Fellowship
(letter no. 2012-13/21095) for nancial support.
FIGURE 12. LC chromatogram.
FIGURE 11. Mass spectra of 1st MS peak.
FIGURE 13. Mass spectra of 2nd MS peak.
Table 5: This table is showing the Rt, mass / charge
ratio and molecular formula results of two major
peaks detected by HPLC –HR- MS.
Attributes Peak 1 Peak 2
Retention time (Rt) 11.271 12.418
Molecular mass to
charge ratio
293.1521 548.2242
Molecular formula C
18
H
24
O
3
C
24
H
37
N
3
O
9
S
The GC-MS is preferable choice for analysis of com-
plex chemical identi cation and isolation and assess
the metabolite pro le of plant(Rohloff, 2015). Here, GC
results revolved a more than 20 minutes noise in the
chromatogram and no organic compound was detected.
Only two siloxane compounds after 20 minutes were
detected. This two compounds were among the base
plate material of TLC plate (Tetracosamethyl –cyclodo-
decasiloxane and Cyclononasiloxane, octadecamethyl)
were detected (Fig. 10). It elucidated the possibilities on
nonvolatile nature of the isolated band or also a pos-
sibility of compound’s concentration under below the
detection limit.
After that HPLC – MS studies were performed and
method was developed. The HPLC-MS IS also very iden-
tical for isolation – puri cation method development
of marker compounds (Cheng et al., 2007). The HPTLC

Vinars Dawaneand M. H. Fulekar
848 DEVELOPMENT OF HPTLC METHODS FOR ISOLATION AND CHARACTERIZATION BIOSCIENCE BIOTECHNOLOGY RESEARCH COMMUNICATIONS
REFERENCE
Bimal, N., &Sekhon, B. S. (2013). High performance thin layer
chromatography: Application in pharmaceutical science.
Pharm Tech Med, 2, 323-33.
Brusotti, G., Cesari, I., Dentamaro, A., Caccialanza, G., &Mas-
solini, G. (2014). Isolation and characterization of bioactive
compounds from plant resources: The role of analysis in the
ethnopharmacological approach. Journal of pharmaceutical
and biomedical analysis, 87, 218-228.
Bucar, F., Wube, A., &Schmid, M. (2013). Natural product isola-
tion–how to get from biological material to pure compounds.
Natural product reports, 30(4), 525-545.
Butler, M. S., & Newman, D. J. (2008). Mother Nature’s gifts to
diseases of man: the impact of natural products on anti-infec-
tive, anticholestemics and anticancer drug discovery. In Natural
Compounds as Drugs Volume I (pp. 1-44). Birkhäuser Basel.
Calixto, J. B. (2000). Ef cacy, safety, quality control, marketing
and regulatory guidelines for herbal medicines (phytothera-
peutic agents). Brazilian Journal of Medical and Biological
Research, 33(2), 179-189.
Chan, K. (2003). Some aspects of toxic contaminants in herbal
medicines. Chemosphere, 52(9), 1361-1371.
Chen, T., Liu, Y., Zou, D., Chen, C., You, J., Zhou, G.& Li, Y.
(2014). Application of an ef cient strategy based on liquid–liq-
uid extraction, highspeed countercurrent chromatography,
and preparative HPLC for the rapid enrichment, separation,
and puri cation of four anthraquinones from Rheum tanguti-
cum.Journal of separation science, 37(1-2), 165-170.
Cheng, W. Y., Kuo, Y. H., & Huang, C. J. (2007). Isolation and
identi cation of novel estrogenic compounds in yam tuber
(Dioscoreaalata Cv. Tainung No. 2). Journal of agricultural and
food chemistry, 55(18), 7350-7358.
Clardy, J., & Walsh, C. (2004). Lessons from natural molecules.
Nature, 432(7019), 829-837.
Dawane, V., Pathak, B., &Fulekar, M. H. (2016). HPTLC pattern
assessment of Avicennia marina stem and spectrometric analy-
sis of the separated phyto-constituents. Bioscience Biotechnol-
ogy Research Communications, 9(1), 114-120.
Ernst, E. (2002). Adulteration of Chinese herbal medicines with
synthetic drugs: a systematic review. Journal of internal medi-
cine, 252(2), 107-113.
Ernst, E. (2003). Herbal medicines put into context: their use
entails risks, but probably fewer than with synthetic drugs.
British Medical Journal, 327(7420), 881.
Han, L., Huang, X., Dahse, H. M., Moellmann, U., Fu, H., Gra-
bley, S., ...& Lin, W. (2007). Unusual naphthoquinone deriva-
tives from the twigs of Avicennia marina. Journal of natural
products, 70(6), 923-927.
Jain, R., Monthakantirat, O., Tengamnuay, P., & De-Eknamkul,
W. (2014). Avicequinone C isolated from Avicennia marina
exhibits 5-reductase-type 1 inhibitory activity using an
androgenic alopecia relevant cell-based assay system. Mol-
ecules, 19(5), 6809-6821.
Li, S., Han, Q., Qiao, C., Song, J., Cheng, C. L., & Xu, H. (2008).
Chemical markers for the quality control of herbal medicines:
an overview. Chinese medicine, 3(1), 1.
Loescher, C., M., Morton D., W., Razic, S., Kustrin S., A. (2014).
High performance thin layer chromatography (HPTLC) and
high performance liquid chromatography (HPLC) for the
qualitative and quantitative analysis of Calendula of cinalis—
Advantages and limitations. Journal of Pharmaceutical and
Biomedical Analysis, 98, 52–59.
Mohammed, N. S., Srinivasulu, A., &Chittibabu, B. (2014). Iso-
lation and puri cation of antibacterial principle from Avicen-
nia marinaL in methanol. International Journal of Pharmacy
and Pharmaceutical Sciences, 7(1), 38-41.
Morlock, G., &Schwack, W. (2006). Determination of isopro-
pylthioxanthone (ITX) in milk, yoghurt and fat by HPTLC-FLD,
HPTLC-ESI/MS and HPTLC-DART/MS. Analytical and bioana-
lytical chemistry, 385(3), 586-595.
Newman, D. J., &Cragg, G. M. (2007). Natural Products as
Sources of New Drugs over the Last 25 Years. Journal of natu-
ral products, 70(3), 461-477.
Newman, D. J., &Cragg, G. M. (2016). Natural products as
sources of new drugs from 1981 to 2014. Journal of natural
products, 79(3), 629-661.
Nikam, P. H., Kareparamban, J., Jadhav, A., & Kadam, V. (2012).
Future Trends in Standardization of Herbal Drugs.Journal of
Applied Pharmaceutical Science, 02(06), 38-44.
Ong, E. S. (2004). Extraction methods and chemical standardi-
zation of botanicals and herbal preparations. Journal of Chro-
matography B, 812(1), 23-33.
Rasheed, N. M. A., Nagaiah, K., Goud, P. R., & Sharma, V. U. M.
(2012). Chemical marker compounds and their essential role in
quality control of herbal medicines. Ann. Phytomed, 1(1), 1-8.
Reich, E., &Schibli, A. (2007). High-performance thin-layer
chromatography for the analysis of medicinal plants. Thieme.
Riffault, L., Destandau, E., Pasquier, L., André, P., &Elfakir, C.
(2014). Phytochemical analysis of Rosa hybridaJardin de Gran-
villeby HPTLC, HPLC-DAD and HPLC-ESI-HRMS: Polyphenolic
ngerprints of six plant organs. Phytochemistry, 99, 127-134.
Rohloff, J. (2015). Analysis of phenolic and cyclic compounds
in plants using derivatization techniques in combination with
GC-MS-based metabolite pro ling. Molecules, 20(2), 3431-
3462.
Rui, J., Yuewei, G., &Huixin, H. (2004). Studies on the chemi-
cal constituents from leaves of Avicennia marina.Chin. J. Nat.
Med, 2, 16-9.
Ruiz, G. G., Nelson, E. O., Kozin, A. F., Turner, T. C., Waters, R.
F., & Langland, J. O. (2016). A Lack of Bioactive Predictability
for Marker Compounds Commonly Used for Herbal Medicine
Standardization. PloS one, 11(7), e0159857.
Sasidharan, S., Chen, Y., Saravanan, D., Sundram, K. M.,
&Latha, L. Y. (2011). Extraction, isolation and characterization
of bioactive compounds from plants’ extracts. African Jour-
nal of Traditional, Complementary and Alternative Medicines;
8(1): 1-10.

Vinars Dawaneand M. H. Fulekar
BIOSCIENCE BIOTECHNOLOGY RESEARCH COMMUNICATIONS DEVELOPMENT OF HPTLC METHODS FOR ISOLATION AND CHARACTERIZATION 849
Thatoi, H., Samantaray, D., & Das, S. K. (2016). The genus Avi-
cennia, a pioneer group of dominant mangrove plant species
with potential medicinal values: a review. Frontiers in Life Sci-
ence, 1-25.
Tistaert, C., Dejaegher, B., & Vander Heyden, Y. (2011). Chro-
matographic separation techniques and data handling meth-
ods for herbal ngerprints: a review. AnalyticaChimicaActa,
690(2), 148-161.
Waksmundzka-Hajnos, M., Sherma, J., &Kowalska, T. (Eds.).
(2008). Thin layer chromatography in phytochemistry. CRC Press.
Wilson, I. D. (1999). The state of the art in thin-layer chro-
matography–mass spectrometry: a critical appraisal.Journal of
Chromatography A, 856(1), 429-442.
World Health Organization (WHO). (2001). WPR/RC52/7: a
Draft Regional strategy for Traditional Medicine in western
paci c. WHO Regional committee. 52nd Session Brunei Darus-
salam, 9(10).
Xie, P., Chen, S., Liang, Y. Z., Wang, X., Tian, R., & Upton,
R. (2006). Chromatographic ngerprint analysis—a rational
approach for quality assessment of traditional Chinese
herbal medicine. Journal of chromatographyA, 1112(1), 171-
180.
Zhu, F., Chen, X., Yuan, Y., Huang, M., Sun, H., & Xiang, W.
(2009). The chemical investigations of the mangrove plant
Avicennia marina and its endophytes. The Open Natural Prod-
ucts Journal, 2(1), 24-32.