Biomedical
Communication
Biosci. Biotech. Res. Comm. 9(4): 809-813 (2016)
Social class changes and its impact on Body Mass Index
amongst women of Chandigarh
Manju Dewan
Post Graduate Department of Zoology, DAV College, Sector 10, Chandigarh
ABSTRACT
Socioeconomic status shows a stronger relationship with obesity. Prevalence of raised body mass index increases with
income level of countries up to upper middle income levels. On the basis of education levels of the women, working
status and monthly income status. Scores were calculated using Kuppuswamy’s socioeconomic status. In the second
stage, anthropometric measurements of weight and height were recorded utilizing the standard equipments and
methodology.14% of women belonged to Upper class and 26%,39%,11.3% and 9.3% were in upper middle ,middle,
upper lower and lower classes respectively. Overweight women were more in upper middle and middle class. Obese I
women were more in middle class and obese-II were more in upper class. Trend of increase in obesity is from middle
class towards upper class. Rising national incomes in developing countries and increased `Westernization’ will most
likely lead to increased levels of obesity in the future. Trend of increase in obesity is from middle class towards upper
class. Income levels are related with different dietary habits and behavior that can lead to obesity. Future research
should also try to better understand shift in the burden of obesity in different socioeconomic status among women.
KEY WORDS: SOCIOECONOMIC STATUS, OBESITY,UPPER CLASS, MIDDLE CLASS
809
ARTICLE INFORMATION:
*Corresponding Author: manjudewan72@gmail.com
Received 25
th
Sep, 2016
Accepted after revision 23
rd
Nov, 2016
BBRC Print ISSN: 0974-6455
Online ISSN: 2321-4007
Thomson Reuters ISI ESC and Crossref Indexed Journal
NAAS Journal Score 2015: 3.48 Cosmos IF : 4.006
© A Society of Science and Nature Publication, 2016. All rights
reserved.
Online Contents Available at: http//www.bbrc.in/
INTRODUCTION
Socioeconomic status (SES) is often measured as a com-
bination of education, income and occupation. SES
affects the physical and mental health. The opening
of the Indian economy has resulted in rapid economic
boom and urbanization in this country. Prevalence of
raised body mass index increases with income level of
countries up to upper middle income levels. Income lev-
els are related with different dietary habits and behav-
ior that can lead to obesity. Between 1988–1994 and
2007–2008 the prevalence of obesity increased in adults
at all income and education levels.There is also a grow-
ing body of evidence that suggests that socio-economic
position (SEP) is a risk factor for obesity. The association
between socioeconomic status (SES) and obesity has not
810 SOCIAL CLASS CHANGES AND ITS IMPACT ON BODY MASS INDEX BIOSCIENCE BIOTECHNOLOGY RESEARCH COMMUNICATIONS
Manju Dewan
been assessed in developing countries, (Cynthia et al,
2010, Shunquan et al 2015 and Leileiet al 2015).
Different socioeconomic status and its relationship
with obesity and type 2 diabetes in women menin
d
e
v
e
l-
o
p
i
ng c
ountries such as
I
n
d
i
a
in uence people’s life-
stylesuchas
d
i
et
,
food
c
o
n
s
u
m
pt
i
o
n
p
atte
r
n
s
andpub-
lic services such as health care and physical activity.
There is tremendous difference in the economic develop-
ment in different regions of India with lower SES levels.
Thus, a deep understanding of the SES-obesity relation-
ship can provide signi cant approach for developing
effective obesity-prevention programs. This study aims
to explore the effect of SES on overweight/obesity on
gender in Chandigarh.
METHODOLOGY
First of all population data of Chandigarh was taken from
Directorate of census operations, Chandigarh as per cen-
sus 2011.The sector wise population and other parameters
have been discussed with the statistician and sample size
from each sector was decided. Standardization of appa-
ratuses was done. Women aged >20 and <60 years were
randomly selected by multistage cluster sampling. At the
time of the initiating the study, in rst stage, 350 women
participated in the study. But 300 women competed the
all stages of study i.e. Questionnaire & dietary survey and
anthropometric measurements. All were informedabout
the study protocol and written consent was obtained.
Kuppuswamy’s socioeconomic status scale was used to
draw the information regarding socioeconomic status (
Kuppuswamy 1981, Mishra and Singh., 2003)
On the basis of education levels of the women, work-
ing status and monthly income status , Scores were
calculated using Kuppuswamy’s socioeconomic status.
In the second stage, anthropometric measurements of
weight and height were recorded utilizing the stand-
ard equipments and methodology. Weight was recorded
using electronic weighing scale to nearest 100 kg. Height
was recorded using the anthropometric rods. Three read-
ing of height and weight were taken and the mean of the
last two readings was considered as nal.
RESULTS AND DISCUSSION
14% of women belonged to Upper class and
26%,39%,11.3% and 9.3% were in upper middle ,mid-
dle, upper lower and lower classes respectively. Educa-
tion levels of the women, working status and monthly
income status were given in Tables 1,2 &3. Overweight
women were more in upper middle and middle class.
Obese I women were more in middle class and obese-II
were more in upper class Table 4. But there is no sig-
ni cant difference in obese-I categories Table 5. It was
analyzed by social
,
e
c
o
n
o
m
i
c
a
n
d
e
n
v
i
r
o
n
m
e
nt
a
l
fac-
tors those may operate through complex pathways to
in uence obesity
.
Overweight and obesity in early life are associated
with increased risk of hypertension, heart disease, dia-
betes mellitus, and sleep disturbances in adulthood (Ng.,
2014) Socioeconomic status shows a stronger bond with
obesity and lack of recreational physical activity in
women than in any other subgroup. Low income, ethnic
minority women have the highest inactivity rates in the
USA (Albright et al. 2005; Ball et al. 2006).
In 2007–2008 more than one-third of United States
adults were obese (Flegal et al 2010). Obese individuals
are at increased risk of diabetes mellitus, cardiovascu-
lar disease, hypertension, and certain cancers, among
other conditions (National Institutes of Health,1998).
Some studies have shown a relationship between obe-
sity prevalence and socioeconomic status measured as
educational level or income (Sobal and Stunkard,1989
and McLaren (2007)).
These results are consistent with
other reported studies in China (Xiao et al 2013 and Hou
et al, 2013)
TABLE 1: PREVALENCE OF LITERACY AMONGST SUBJECTS.
LITERACY SCORES NUMBER PERCENTAGE
Illiterate 7 31 10.3%
Primary school certi cate 6 38 12.6%
Middle 5 37 12.3%
High School 4 20 6.7%
Intermediate 3 38 12.7%
Graduate 2 91 30.3%
Post-Graduate 1 45 15%

BIOSCIENCE BIOTECHNOLOGY RESEARCH COMMUNICATIONS SOCIAL CLASS CHANGES AND ITS IMPACT ON BODY MASS INDEX 811
Manju Dewan
TABLE 2: PREVALENCE OF WORKING STATUS AMONGST SUBJECTS.
OCCUPATION SCORES NUMBER PERCENTAGE
Profession 10 72 24%
Semi Profession 6 46 15.3%
Clerical, shop owner, Farmer 5 16 5.3%
Skilled Worker 4 18 6%
Semi-skilled Worker 3 22 7.3%
Unskilled Worker 2 20 6.7%
Unemployed 1 106 35.3%
TABLE 3: MONTHLY INCOME STATUS OF SUBJECTS.
MONTHLY FAMILY INCOME IN RS. SCORES NUMBER PERCENTAGE
>32,050 12 118 39.3%
16020-32049 10 51 17%
12020-16019 6 55 18.3%
8010-12019 4 24 8%
4810-8009 3 23 7.7%
1601-4809 2 16 5.3%
<1600 1 13 4.3%
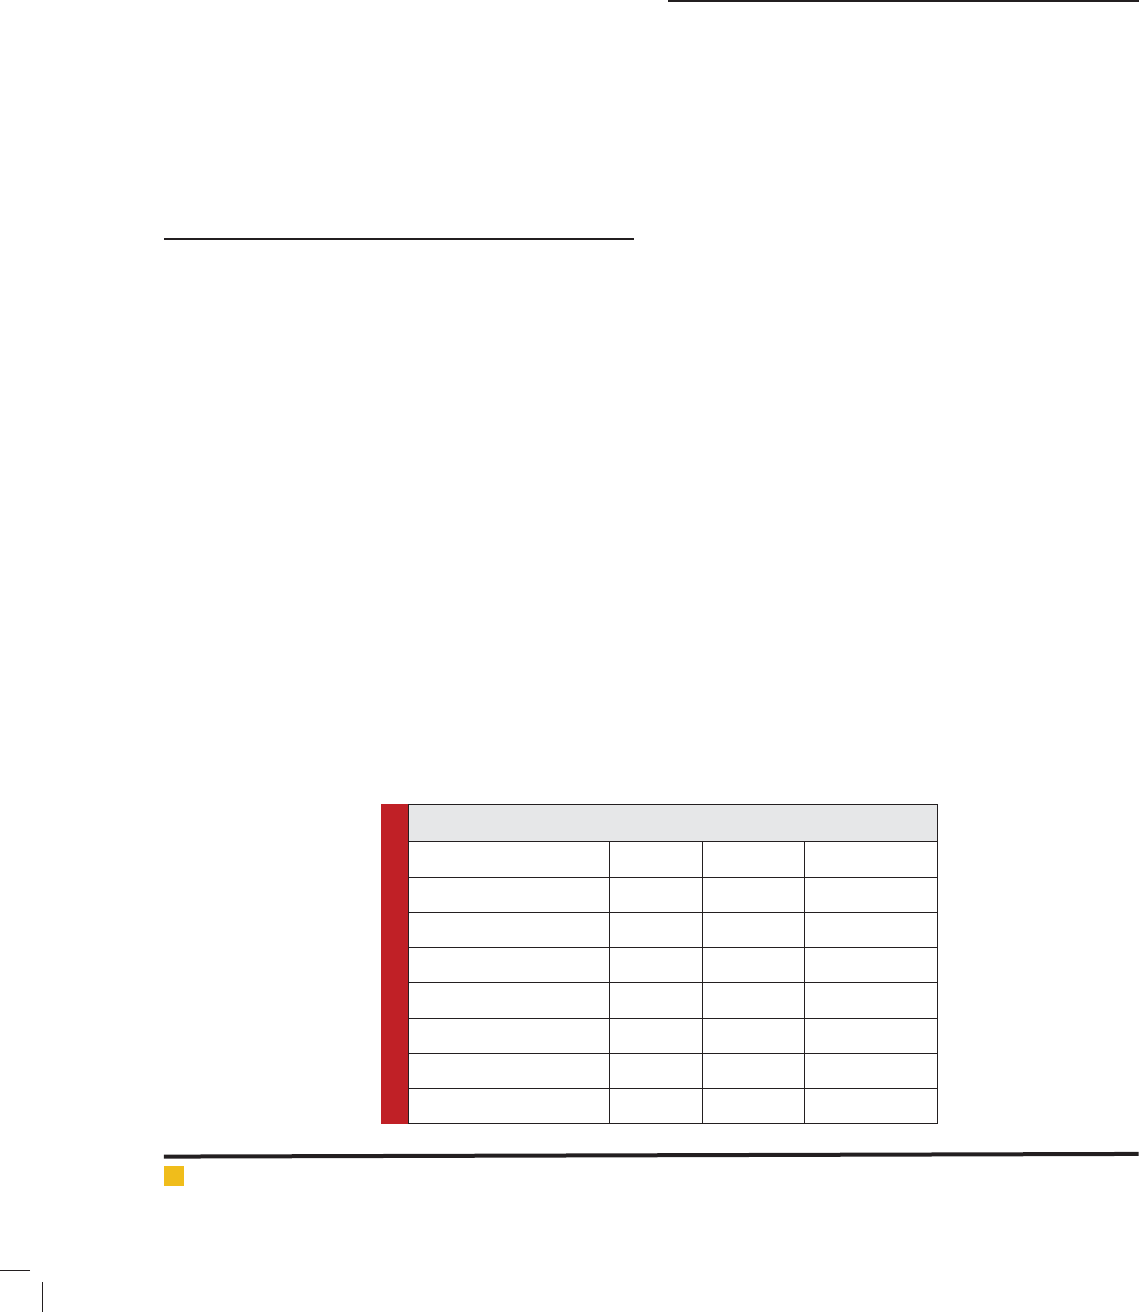
TABLE 4: SOCIOECONOMIC STATUS OF THE SUBJECTS.
TOTAL SCORES SOCIOECONOMIC CLASS NUMBER: 300 PERCENTAGE
26-29 UPPER I 42 14%
16-25 UPPER MIDDLE II 78 26%
11-15 MIDDLE/ LOWER MIDDLE 117 39%
5-10 LOWER /UPPER LOWER 34 11.3%
<5 LOWER 29 9.7%
TABLE 5: RELATIONSHIP OF OBESITY WITH SOCIO-ECONOMIC STATUS OF SUBJECTS.
UPPER-I UPPER-II MIDDLE UPPER LOWER LOWER
TOTAL: 300 42 78 117 34 29
STATUS
Underweight 65 5 (11.9%) 22 (28.2%) 9 (7.7%) 12 (35.3%) 17 (58.6%)
Normal 102 11 (26.2) 15 (19.2%) 59 (50.4%) 12 (35.3%) 5 (17.2%)
Overweight 78 13 (30.9%) 25 (32%) 32 (27.3%) 5 (14.7%) 3 (10.3%)
Obese-I 35 8 (19%) 8 (10.3%) 14 (11.9%) 3 (8.8%) 2 (6.9%)
Obese-II 20 5 (11.9%) 8 (10.3%) 3 (2.6%) 2 (5.9%) 2 (6.9%)

812 SOCIAL CLASS CHANGES AND ITS IMPACT ON BODY MASS INDEX BIOSCIENCE BIOTECHNOLOGY RESEARCH COMMUNICATIONS
Manju Dewan
According to other studies like that of Wells et al
(2012), Melnyk et al (2013) and Qin et al (2013) variables
related to the participants’ life styles were categorized
into different levels, e.g. farming frequency (<3 times/
week and ≥3 times/week), smoking frequency (no smok-
ing and ≥1 cigarette/day), drinking alcohol frequency
(no and ≥1/week) as well as amount of vegetable and
fruit consumption (<500g/week and ≥500g/week).
Negative associations (lower SES associated with
larger body size) for women in highly developed countries
were most common with education and occupation, while
positive associations for women in medium- and low-
development countries were most common with income
and material possessions
(McLaren, 2007). In the present
study most of the women belong to middle class and
overweight women were more in middle class women.
In a study published inDemography, workers have also
looked at how SES is related to obesity in the transition to
early adulthood in the United States (Melissa et al, 2011).
Overall, 29.0% of women who live in households with
income at or above 350% of the poverty level are obese
and 42.0% of those with income below 130% of the pov-
erty level are obese. Trends are similar for non-Hispanic
white, non-Hispanic black, and Mexican American
women, but they are only signi cant for non-Hispanic
white women. Among non Hispanic white women with
income at or above 350% of the poverty level 27.5% are
obese, less than the 39.2% of those with income below
130% of the poverty level. Among women, the preva-
lence increased from 15.3% to 23.4% in college gradu-
ates and from 31.7% to 42.1% in those with less than a
high school diploma. As in men, similar increases were
seen among women with a high school diploma and
among those with some college (Cynthia et al, 2010).
One another study put light on the overall picture of
the association between SES and obesity globally: obe-
sity is a problem of the rich in low-income countries
for both men and women, while there is a mixed pic-
ture in middle-income countries (Dinsa et al,2012).The
relationship between educational attainment and obe-
sity was modi ed by both gender and the country’s eco-
nomic development level: an inverse association was
more common in studies of higher-income countries
and a positive association was more common in lower-
income countries, with stronger social patterning among
women (Alison et al,2013)
Therefore, the wealth of a nation should affect the
prevalence of obesity as well as the relationship between
social class and obesity. There is an obesity epidemic in
developing countries, which is increasingly approaching
the all SES Levels. Rising national incomes in develop-
ing countries and increased `Westernization’ will most
likely lead to increased levels of obesity in the future.
Trend of increase in obesity is from middle class towards
upper class. Future research should also try to better
understand shift in the burden of obesity in different
socioeconomic status among women.
ACKNOWLEDGEMENT
The author is highly thankful to UGC for providing grant
for undertaking the research project.
REFERENCES
Albright, C.L., L. Pruitt, C. Castro, A. Gonzalez, S. Woo, and
A.C. King. (2005). Modifying physical activity in a multieth-
nic sample of low-income women: one-year results from the
IMPACT (Increasing Motivation for Physical Forum on Public
Policy 17 ACTivity) project. Annals of Behavioral Medicine : a
Publication of the Society of Behavioral Medicine 30(3): 191-
200.
Alison K. Cohen,Manisha Rai,David H. Rehkopf, andBarbara
Abrams (2013) Educational attainment and obesity: A system-
atic reviewObes Rev. 2013 Dec; 14(12): 989–1005.
Ball, K., J. Salmon, B. Giles-Corti, and D. Crawford. (2006).
How can socio-economic differences in physical activity
among women be explained? A qualitative study. Women &
Health 43(1): 93-113.
Cynthia L. Ogden, Molly M. Lamb, Margaret D. Carroll and
Katherine M. Flegal (2010) U.S.department of health and human
services Centers for Disease Control and Prevention National
Center for Health Statistics Obesity and Socioeconomic Status
in Adults: United States, 2005–2008 NCHS Data pro le, No.5.
Dinsa GD, Y Goryakin, E Fumagalli, and M Suhrcke (2012)
Obesity and socioeconomic status in developing countries: a
systematic review. Obes Rev. 2012 Nov; 13(11): 1067–1079.
Flegal KM, Carroll MD, Ogden CL, Curtin LR(2010). Prevalence
and trends in obesity among United States adults, 1999–2008.
JAMA 303:235–41
Hou X, Liu Y, Lu H, Ma X, Hu C, Bao Y,(2013)Ten-year changes
in the prevalence of overweight, obesity and abdominal
obesity among the Chinese adults in urban Shanghai, 1998-
2007— comparison of two cross-sectional surveys. BMC Public
Health;13:1064.
Kuppuswamy B. (1981) Manual of Socioeconomic Status
(Urban), 1
st
ed. Delhi: Manasayan; 1981. p. 66-72.
Leilei Pei,Yue Cheng,Yijun Kang,Shuyi Yuan andHong Yan
(2015) : Association of obesity with socioeconomic status
among adults of ages 18 to 80years in rural Northwest China.
BMC Public Health 15:160
McLaren L. (2007) Socioeconomic status and obesity. Epide-
miol Rev 29:29–48. 2007
Melissa Scharoun-Lee., Penny Gordon-Larsen, Linda S.
Adair, Barry M. Popkin, Jay S. Kaufman, and Chirayath M.
Suchindran (2011) Intergenerational Pro les of Socioeconomic
(Dis) Advantage and Obesity During the Transition to Adult-
hood,”Demography48, No. 2, 625-51.

Manju Dewan
BIOSCIENCE BIOTECHNOLOGY RESEARCH COMMUNICATIONS SOCIAL CLASS CHANGES AND ITS IMPACT ON BODY MASS INDEX 813
Melnyk BM, Jacobson D, Kelly S, Belyea M, Shaibi G, Small L.
(2013) Promoting healthy lifestyles in high school adolescents:
a randomized controlled trial. Am J Prev Med.; 45(4):407–15.
Mishra D, Singh HP (2003) . Kuppuswamy’s socioeconomic
status scale - A revision. Indian J Pediatr; 70:273-4
National Institutes of Health(1998) Clinical Guidelines on
the identi cation, evaluation, and treatment of overweight
and obesity in adults-The evidence report. Obes Res 6 Suppl
2:51S–209S
Ng M.(2014). Global, regional, and national prevalence of
overweight and obesity in children and adults during 1980-
2013: a systematic analysis for the Global Burden of Disease
Study. The Lancet.384, 766–781 (2014).
Qin X, Zhang Y, Cai Y, He M, Sun L, Fu J.(2013) Prevalence of
obesity, abdominal obesity and associated factors in hyperten-
sive adults aged 45–75 years. Clin Nutr;32(3):361–7.
Shunquan Wu,Yingying Ding,,Fuquan Wu,,Ruisheng Li,,Yan
Hu,,Jun Hou,&Panyong (2015) Mao Socio-economic position
as an intervention against overweight and obesity in children:
a systematic review and meta-analysis. Scienti c Reports5:
Articlenumber:11354
Sobal J, Stunkard AJ.(1989) Socioeconomic status and obesity:
A review of the literature. Psychol Bull 105:260–75.
Wells JC, Marphatia AA, Cole TJ, McCoy D.(2012) Associa-
tions of economic and gender inequality with global obesity
prevalence: Understanding the female excess. Soc Sci Med.;
75:482–90.
Wichai Aekplakorn,Rungkarn Inthawong, Pattapong Kessom-
boon,Rassamee Sangthong,Suwat Chariyalertsak,Panwadee
Putwatana, and Surasak Taneepanichskul (2014) Prevalence
and Trends of Obesity and Association with Socioeconomic
Status in Thai Adults: National Health Examination Surveys,
1991–2009. J Obes : 410259.
Xiao Y, Zhao N, Wang H, Zhang J, He Q, Su D. (2013) Associa-
tion between socioeconomic status and obesity in a Chinese
adult population. BMC Public Health ;13:355.